Understanding one's own attitudes and beliefs, especially when they are detrimental to one's mental health, is a crucial step in addressing and mitigating the effects of depression. The Dysfunctional Attitude Scale Forms, DAS-SF1 and DAS-SF2, serve this exact purpose by efficiently gauging negative cognition commonly associated with depression. Developed through rigorous research by Christopher G. Beevers, David R. Strong, and their colleagues, these short-form scales have demonstrated strong reliability and validity, offering a quick yet accurate method for assessing dysfunctional attitudes. These scales, consisting of carefully selected items that reflect rigid, perfectionist, and self-depreciating beliefs, are a testament to the advancements in psychological assessment. The scoring of these forms is designed to reflect the severity of dysfunctional attitudes, with higher scores indicating greater levels of dysfunctional thinking. By providing an efficient tool for the assessment of such attitudes among individuals with depression, these forms not only facilitate research and clinical work but also pave the way for targeted interventions, ultimately contributing to the improvement of mental health outcomes.
| Question | Answer |
|---|---|
| Form Name | Dtsfunctional Additude Scale |
| Form Length | 14 pages |
| Fillable? | No |
| Fillable fields | 0 |
| Avg. time to fill out | 3 min 30 sec |
| Other names | dysfunctional attitude scale 40 item pdf, dysfunctional attitude scale 40 items pdf, das questionnaire, dysfunctional attitude scale quiz |
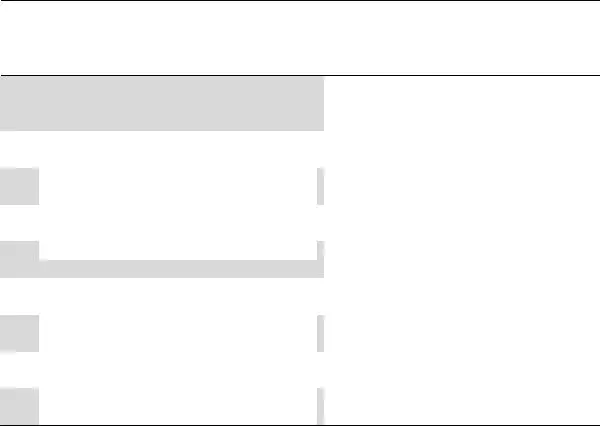
The sentences below describe people’s attitudes. Circle the number which best describes how much each sentence describes your attitude. Your answer should describe the way you think most of the time.
TotallyAgree Agree Disagree DisagreeTotally
If I don’t set the highest standards for
1.myself, I am likely to end up a
My value as a person depends greatly on
2.what others think of me.
3.People will probably think less of me if I make a mistake.
4.I am nothing if a person I love doesn’t love me.
5.If other people know what you are really like, they will think less of you.
6.If I fail at my work, then I am a failure as a person.
My happiness depends more on other
7.people than it does me.
8.I cannot be happy unless most people I know admire me.
9.It is best to give up your own interests in order to please other people.
1 |
2 |
3 |
4 |
|
|
|
|
1 |
2 |
3 |
4 |
|
|
|
|
1 |
2 |
3 |
4 |
|
|
|
|
1 |
2 |
3 |
4 |
|
|
|
|
1 |
2 |
3 |
4 |
|
|
|
|
1 |
2 |
3 |
4 |
|
|
|
|
1 |
2 |
3 |
4 |
|
|
|
|
1 |
2 |
3 |
4 |
|
|
|
|
1 |
2 |
3 |
4 |
|
|
|
|
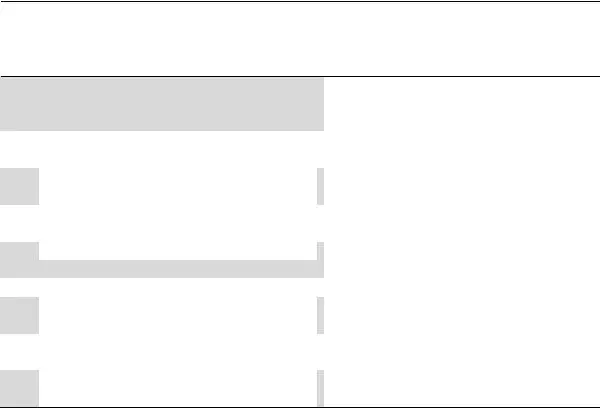
The sentences below describe people’s attitudes. Circle the number which best describes how much each sentence describes your attitude. Your answer should describe the way you think most of the time.
TotallyAgree Agree Disagree DisagreeTotally
If I am to be a worthwhile person, I must
1.be truly outstanding in at least one major respect.
If you don’t have other people to lean on,
2.you are bound to be sad.
3.I do not need the approval of other people in order to be happy.
4.If you cannot do something well, there is little point in doing it at all.
5.If I do not do well all the time, people will not respect me.
6.If others dislike you, you cannot be happy.
7.People who have good ideas are more worthy than those who do not.
8.If I do not do as well as other people, it means I am an inferior human being.
9.If I fail partly, it is as bad as being a complete failure.
1 |
2 |
3 |
4 |
|
|
|
|
1 |
2 |
3 |
4 |
|
|
|
|
1 |
2 |
3 |
4 |
|
|
|
|
1 |
2 |
3 |
4 |
|
|
|
|
1 |
2 |
3 |
4 |
|
|
|
|
1 |
2 |
3 |
4 |
1 |
2 |
3 |
4 |
|
|
|
|
1 |
2 |
3 |
4 |
|
|
|
|
1 |
2 |
3 |
4 |
|
|
|
|
Scoring
Items should be scored so that total score reflects greater dysfunctional attitudes. This means that most items will be reverse coded. Subtracting 5 from an item score will reverse score that item.

Psychological Assessment |
Copyright 2007 by the American Psychological Association |
2007, Vol. 19, No. 2, 199 |
Efficiently Assessing Negative Cognition in Depression: An Item Response
Theory Analysis of the Dysfunctional Attitude Scale
Christopher G. Beevers |
David R. Strong |
University of Texas at Austin |
Brown University and Butler Hospital |
Bjo¨ rn Meyer |
Paul A. Pilkonis |
City University, London |
University of Pittsburgh Medical Center |
Ivan W. Miller
Brown University and Butler Hospital
Despite a central role for dysfunctional attitudes in cognitive theories of depression and the widespread use of the Dysfunctional Attitude Scale, form A
Keywords: cognitive, short form, depression, dysfunctional attitudes, item response theory
A central tenet of cognitive theory of depression is that dys- functional attitudes have a critical etiologic role for vulnerability to depression (Beck, Rush, Shaw, & Emery, 1979). Individuals who endorse dysfunctional attitudes are thought to be at increased risk for depression onset (e.g., Alloy et al., 2006; Segal, Gemar, & Williams, 1999). Further, elevations in dysfunctional attitudes are thought to maintain an episode and are often central targets of
intervention during cognitive– behavioral treatment. Consistent with these ideas, numerous studies have observed high levels of dysfunctional attitudes among people diagnosed with unipolar depression (e.g., Dent & Teasdale, 1988; Norman, Miller, & Dow, 1988).
Dysfunctional attitudes are often assessed with the Dysfunc- tional Attitude Scale (DAS; Weissman, 1979). The DAS was
Christopher G. Beevers, Department of Psychology, University of Texas at Austin; David R. Strong, Department of Psychiatry and Human Behavior, Brown University, and Addictions Research, Butler Hospital, Providence, Rhode Island; Bjo¨rn Meyer, Department of Psychology, City University, London, London, England; Paul A. Pilkonis, Department of Psychiatry, West- ern Psychiatric Institute and Clinic, University of Pittsburgh Medical Center; and Ivan W. Miller, Department of Psychiatry and Human Behavior, Brown University, and Psychosocial Research Program, Butler Hospital.
Research reported in this article was supported in part by several National Institute of Mental Health (NIMH) grants. Research conducted at Butler Hospital and Brown Medical School was supported by NIMH Grant MH43866; Ivan W. Miller was the principal investigator. Research conducted as part of the NIMH Treatment of Depression Collaborative Research Program was part of a multisite program initiated and sponsored by the NIMH Psy- chosocial Treatments Research Branch. The program was funded by cooper- ative agreements to six sites: George Washington University, MH33762; University of Pittsburgh, MH33753; University of Oklahoma, MH33760; Yale University, MH33827; Clarke Institute of Psychiatry, University of Toronto, MH38231; and
principal NIMH collaborators were Irene Elkin, coordinator; Tracie Shea, associate coordinator; John P. Docherty; and Morris B. Parloff. The principal investigators and project coordinators at the three research sites were Stuart M. Sotsky and David Glass (George Washington University), Stanley D. Imber and Paul A. Pilkonis (University of Pittsburgh), and John T. Watkins and William Leber (University of Oklahoma). The principal investigators and project coordinators at the three sites responsible for training therapists were Myrna Weissman, Eve Chevron, and Bruce J. Rounsaville (Yale University); Brian F. Shaw and T. Michael Vallis (Clarke Institute of Psychiatry); and Jan A. Fawcett and Phillip Epstein
We thank Aaron T. Beck for allowing us to reproduce items from the original Dysfunctional Attitude Scale.
Correspondence concerning this article should be addressed to Christo- pher G. Beevers, Department of Psychology, University of Texas at Austin,
1University Station A8000, Austin, TX
199
200 |
BEEVERS, STRONG, MEYER, PILKONIS, AND MILLER |
originally a
Studies that have investigated the psychometric properties of the
.59) with each other. Using structural equation modeling, Zuroff, Blatt, Sanislow, Bondi, and Pilkonis (1999) reported that the Perfectionism and Need for Approval subscales had high factor loadings (.87 and .85, respectively) on a common latent variable. These findings suggest that the
Although these studies made important contributions to the development of the
An additional benefit of using IRT to refine the
length of questionnaires could reduce subject burden. Alterna- tively, if subject burden is already minimal, briefer questionnaires could allow for more frequent assessments during treatment with- out substantially increasing subject burden. Repeated assessments are often critical for identifying putative mediators (cf. Kraemer, Wilson, Fairburn, & Agras, 2002). Finally, psychopathology re- search may also benefit from a shorter version of the DAS, as level of dysfunctional attitudes measured following a dysphoric mood induction is linked to depression vulnerability (Segal et al., 2006). As mood states induced in the laboratory tend to be brief (Martin, 1990), a dysfunctional attitude scale that can be completed quickly may provide an assessment that is more uniformly influenced by a mood induction.
Given the widespread influence of cognitive theory on etiologic and treatment studies of depression (Beck, 2005), the prevalent use of the
To achieve these goals, we pooled data from two treatment studies of unipolar depression: a randomized clinical trial (RCT) comparing the efficacy of several treatments among depressed outpatients (TDCRP; Elkin, 1994) and an RCT comparing the efficacy of several depression treatments in the posthospital care of depressed inpatients (Miller et al., 2005). Using IRT methods, we examined the
Method
Participants
Data were pooled from two RCTs for unipolar depression (N 367). The first RCT was the TDCRP. The design and procedures of the TDCRP have been described in detail elsewhere (e.g., Elkin, 1994). A total of 250 patients met study entry criteria and were randomly assigned to treatment; of these, pre- and posttreatment
IRT ANALYSIS OF THE DAS |
201 |
discharged depressed inpatients should allow us to evaluate the performance of the
Measures
DAS (Weissman, 1979). The
Beck Depression Inventory (BDI; Beck & Steer, 1993). The BDI is a widely used
Cognitive Bias Questionnaire (CBQ; Krantz & Hammen, 1979). The CBQ was used to assess negatively biased,
Hopelessness Scale (HS; Beck, Weissman, Lester, & Trexler, 1974). The HS is a
Statistical Model: Overview of Item Response Theory (IRT) Analyses
IRT methods provide a means of scaling both items and persons along a theorized underlying latent continuum of dysfunctional attitudes. These methods assume that individuals vary along a
single latent continuum. Thus, a common factors analysis was conducted prior to IRT modeling. With support for a primary dimension underlying the DAS, we chose to apply a nonparametric IRT modeling strategy to explore the performance of individual DAS items.
Two broad classes of IRT models include parametric (cf. Birn- baum, 1968; Rasch, 1960) and nonparametric approaches (cf. Mokken & Lewis, 1982; Molenaar, 1997; Ramsay, 1991). We chose to use a nonparametric approach to modeling responses to the
Using a nonparametric approach, we constructed item charac- teristic curves that relate the likelihood of endorsing increasing scores on each item to latent levels of dysfunctional attitudes prior to examining the performance of individual options. We then examined items’ option characteristic curves (OCCs). These OCCs relate the likelihood of endorsing each option on each item to latent levels of dysfunctional attitudes. On the basis of examination of the OCC, items with poor discrimination were identified and dropped from further analysis. Items were identified as having good discrimination if the likelihood of choosing higher options (e.g., “agree very much” vs. “disagree very much”) increased systematically with increasing levels of dysfunctional attitudes. Poor discrimination was identified when higher item options failed to be observed with higher likelihood than lower options despite increases in levels of dysfunctional attitudes. We required that items provide information (e.g., higher options become more likely than lower options) within ranges of the dysfunctional attitudes that would be observed within a significant number of individuals in the present sample
Finally, to explore whether improvements in the efficiency of the
We used a nonparametric
202 |
BEEVERS, STRONG, MEYER, PILKONIS, AND MILLER |
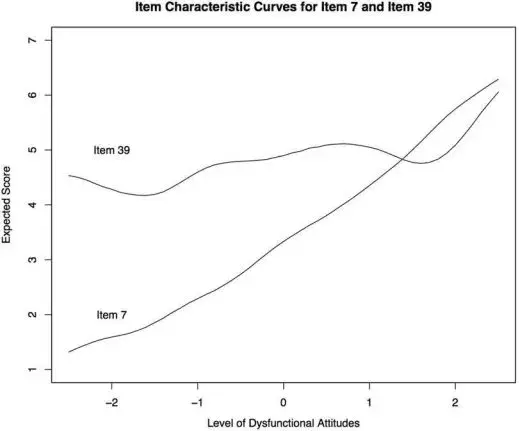
fall closer to the specific evaluation point. We considered items to have good response properties if (a) the probability of endorsing increasingly severe response options increased with increasing levels of dysfunctional attitudes and (b) if curves for at least some of the response options intersected more than once between the 5th and 95th percentiles of estimated dysfunctional attitudes.
Results
Unidimensionality
We conducted maximum likelihood common factors analysis of polychoric correlations for the 40
Item Response Analysis
We next submitted all
After we dropped the 16 items that failed to make multiple dis- criminations, the remaining 24 items were resubmitted to analyses. Although all 24 items appeared to make adequate discriminations, not
Figure 1. Example of one item (Item 7) that performs well in making discriminations throughout the continuum of dysfunctional attitudes. The second item (Item 39) performs poorly, failing to make multiple discriminations within the 5th to 95th percentiles.
IRT ANALYSIS OF THE DAS |
203 |
all response options were making discriminations. Poorly functioning response options could contribute to decreased reliability in rank ordering individual levels of dysfunctional attitudes.
Examining Utility of Response Options
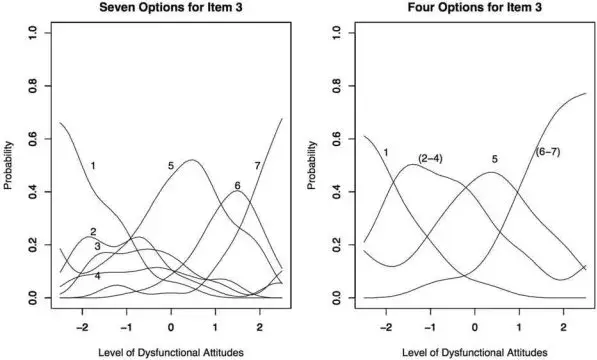
We examined the seven response options to determine whether poorly performing options might be collapsed, as several of the response options were rarely used and were never more likely to be observed than were other options. The OCC for Option 1 (“totally agree”) and Option 5 (“agree”) performed consistently across items, made distinct discriminations, and were clearly more likely to be endorsed than were other options within specified ranges of the continuum. However, several other options did not perform consis- tently. Option 4 (“neutral”) performed quite poorly. It was the least frequently used option (endorsed in 7% of responses), and it was never more likely to be endorsed than was any other option across all ranges of the continuum. Across all items and all levels of dysfunc- tional attitudes, the probability of endorsing Option 3 (“agree slightly”) was always higher than was Option 4 (“neutral”), suggest- ing a reversal in the order of these response categories. Further, Option 2 (“agree very much”) was not consistently more likely than was Option 3 (“agree slightly”). Whereas Option 7 (“totally dis- agree”) did become consistently more likely than Option 6 (“very much disagree”), this option was used infrequently (endorsed in 9% of responses), and the range of discrimination typically was above the 95th percentile. Therefore, on the basis of inspection of OCCs, we collapsed Responses 2– 4 (“agree very much,” “agree slightly,” “neu- tral”) and Responses 6 and 7 (“disagree very much,” “totally dis- agree”). This resulted in
In line with analyses, we labeled the four response options as “totally agree,” “agree,” “disagree,” “totally disagree.”
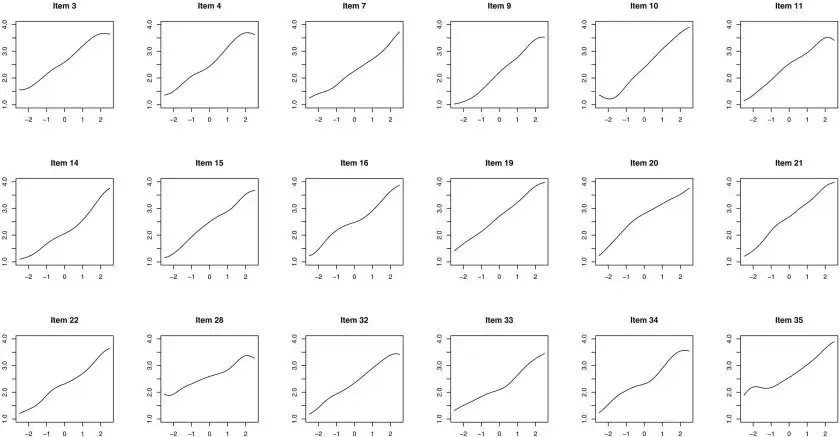
After recoding, the 24 items were reanalyzed, and OCCs were inspected. As a result of the reanalysis, 6 of the 24 items (Items 6, 17, 23, 26, 27, and 38) failed to make more than one discrimination between the 5th and 95th percentiles and were dropped. The 18 DAS items were retained and again reanalyzed. All 18 items continued to show improved OCCs and continued to make at least two discriminations between the 5th and 95th percentiles. To illustrate the importance of the response format, Figure 2 displays the OCC for Item 3. When allowing all seven options, several of the lower level options (e.g., Options 2– 4) were equally likely within the same range of dysfunctional attitudes and thus could be subsumed within the same option. The OCCs were substantially better when response options were collapsed to form a
Figure 3 presents the ICC for the 18 remaining
Figure 2. Improvement in scaling response options for Item 3 with a
204
BEEVERS, STRONG, MEYER, PILKONIS, AND MILLER
Figure 3. Item characteristic curves from the 18

|
|
IRT ANALYSIS OF THE DAS |
205 |
Table 1 |
|
|
|
Items Selected for the Short Forms of the DAS Using IRT Methods |
|
||
|
|
|
|
|
|
|
|
item no. |
Item |
|
|
|
|
|
|
|
|
|
|
20 |
1 |
If I don’t set the highest standard for myself, I am likely to end up a |
|
19 |
2 |
My value as a person depends greatly on what others think of me. |
|
3 |
3 |
People will probably think less of me if I make a mistake. |
|
16 |
4 |
I am nothing if a person I love doesn’t love me. |
|
15 |
5 |
If other people know what you are really like, they will think less of you. |
|
10 |
6 |
If I fail at my work, then I am a failure as a person. |
|
34 |
7 |
My happiness depends more on other people than it does on me. |
|
7 |
8 |
I cannot be happy unless most people I know admire me. |
|
33 |
9 |
It is best to give up your own interests in order to please other people. |
|
|
|
|
|
|
|
|
|
21 |
1 |
If I am to be a worthwhile person, I must be truly outstanding in at least one major respect. |
|
28 |
2 |
If you don’t have other people to lean on, you are bound to be sad. |
|
35 |
3 |
I do not need the approval of other people in order to be happy. |
|
11 |
4 |
If you cannot do something well, there is little point in doing it at all. |
|
4 |
5 |
If I do not do well all the time, people will not respect me. |
|
32 |
6 |
If others dislike you, you cannot be happy. |
|
22 |
7 |
People who have good ideas are more worthy than those who do not. |
|
9 |
8 |
If I do not do as well as other people, it means I am an inferior human being. |
|
14 |
9 |
If I fail partly, it is as bad as being a complete failure. |
|
|
|
|
|
Note. Analyses indicated that a
the items on the basis of the level within which the item was most discriminating. We then split the 18 items by sorting every other item into a separate
Consistency Within and Between DAS Short Forms
We first examined internal consistency reliability (coefficient alpha) for each short form of the DAS. The alphas were .84 and
.83, respectively, for the
We next examined correlations among these newly formed DAS scales and the original
.85). At posttreatment, similarly high correlations were observed. The
.87) with each other at posttreatment.
We also examined whether the means of the short forms were significantly different from each other at each assessment period. At pretreatment, the
0.38points between DAS short forms was statistically significant (in part due to a large sample size), the effect size indicates that this
difference was small. At posttreatment, the
Change in Dysfunctional Attitudes
We next examined change in dysfunctional attitudes, as assessed by the
t(287) .26, p .79, d .01.1 In addition, these change scores were highly correlated with each other (rs ranged from .84 to .91). This suggests that change in dysfunctional attitudes did not sig- nificantly differ across the DAS forms.
1Degrees of freedom vary slightly due to missing data.
