The Algebra 1B Practice Box form serves as a multifaceted tool designed to enhance students' understanding of descriptive statistics, particularly in the use of box-and-whisker plots and the identification and implications of outliers in data sets. It guides students through a series of exercises that range from analyzing the distribution of test scores in a classroom setting to evaluating real-world data, such as the weekly miles run by a cross-country team, and the average monthly rainfall in different cities. By asking students to determine medians, calculate percentages within specified ranges, and reorganize data from least to greatest, the form not only reinforces their grasp of central tendencies and variability but also sharpens their data interpretation skills. Furthermore, through tasks requiring the construction of box plots and the execution of the 1.5 IQR rule to detect outliers, it introduces them to critical statistical concepts in a tangible manner. The exercises also prompt students to consider how outliers impact measures of center, spread, and the overall shape of data distributions, thus providing a comprehensive overview of the consequences of data variability. This practice form exemplifies the practical application of algebra concepts in understanding and analyzing real-life data, offering students a holistic view of the subject's relevance beyond the classroom.
| Question | Answer |
|---|---|
| Form Name | Algebra 1B Practice Box Form |
| Form Length | 2 pages |
| Fillable? | No |
| Fillable fields | 0 |
| Avg. time to fill out | 30 sec |
| Other names | Hagans, Uebelhoers, algebra 1b practice box plot and outlier rule answers, millimeters |
Algebra 1B |
Name _____________________ |
Practice: Box Plot and Outlier Rule |
Block _____ Date ___________ |
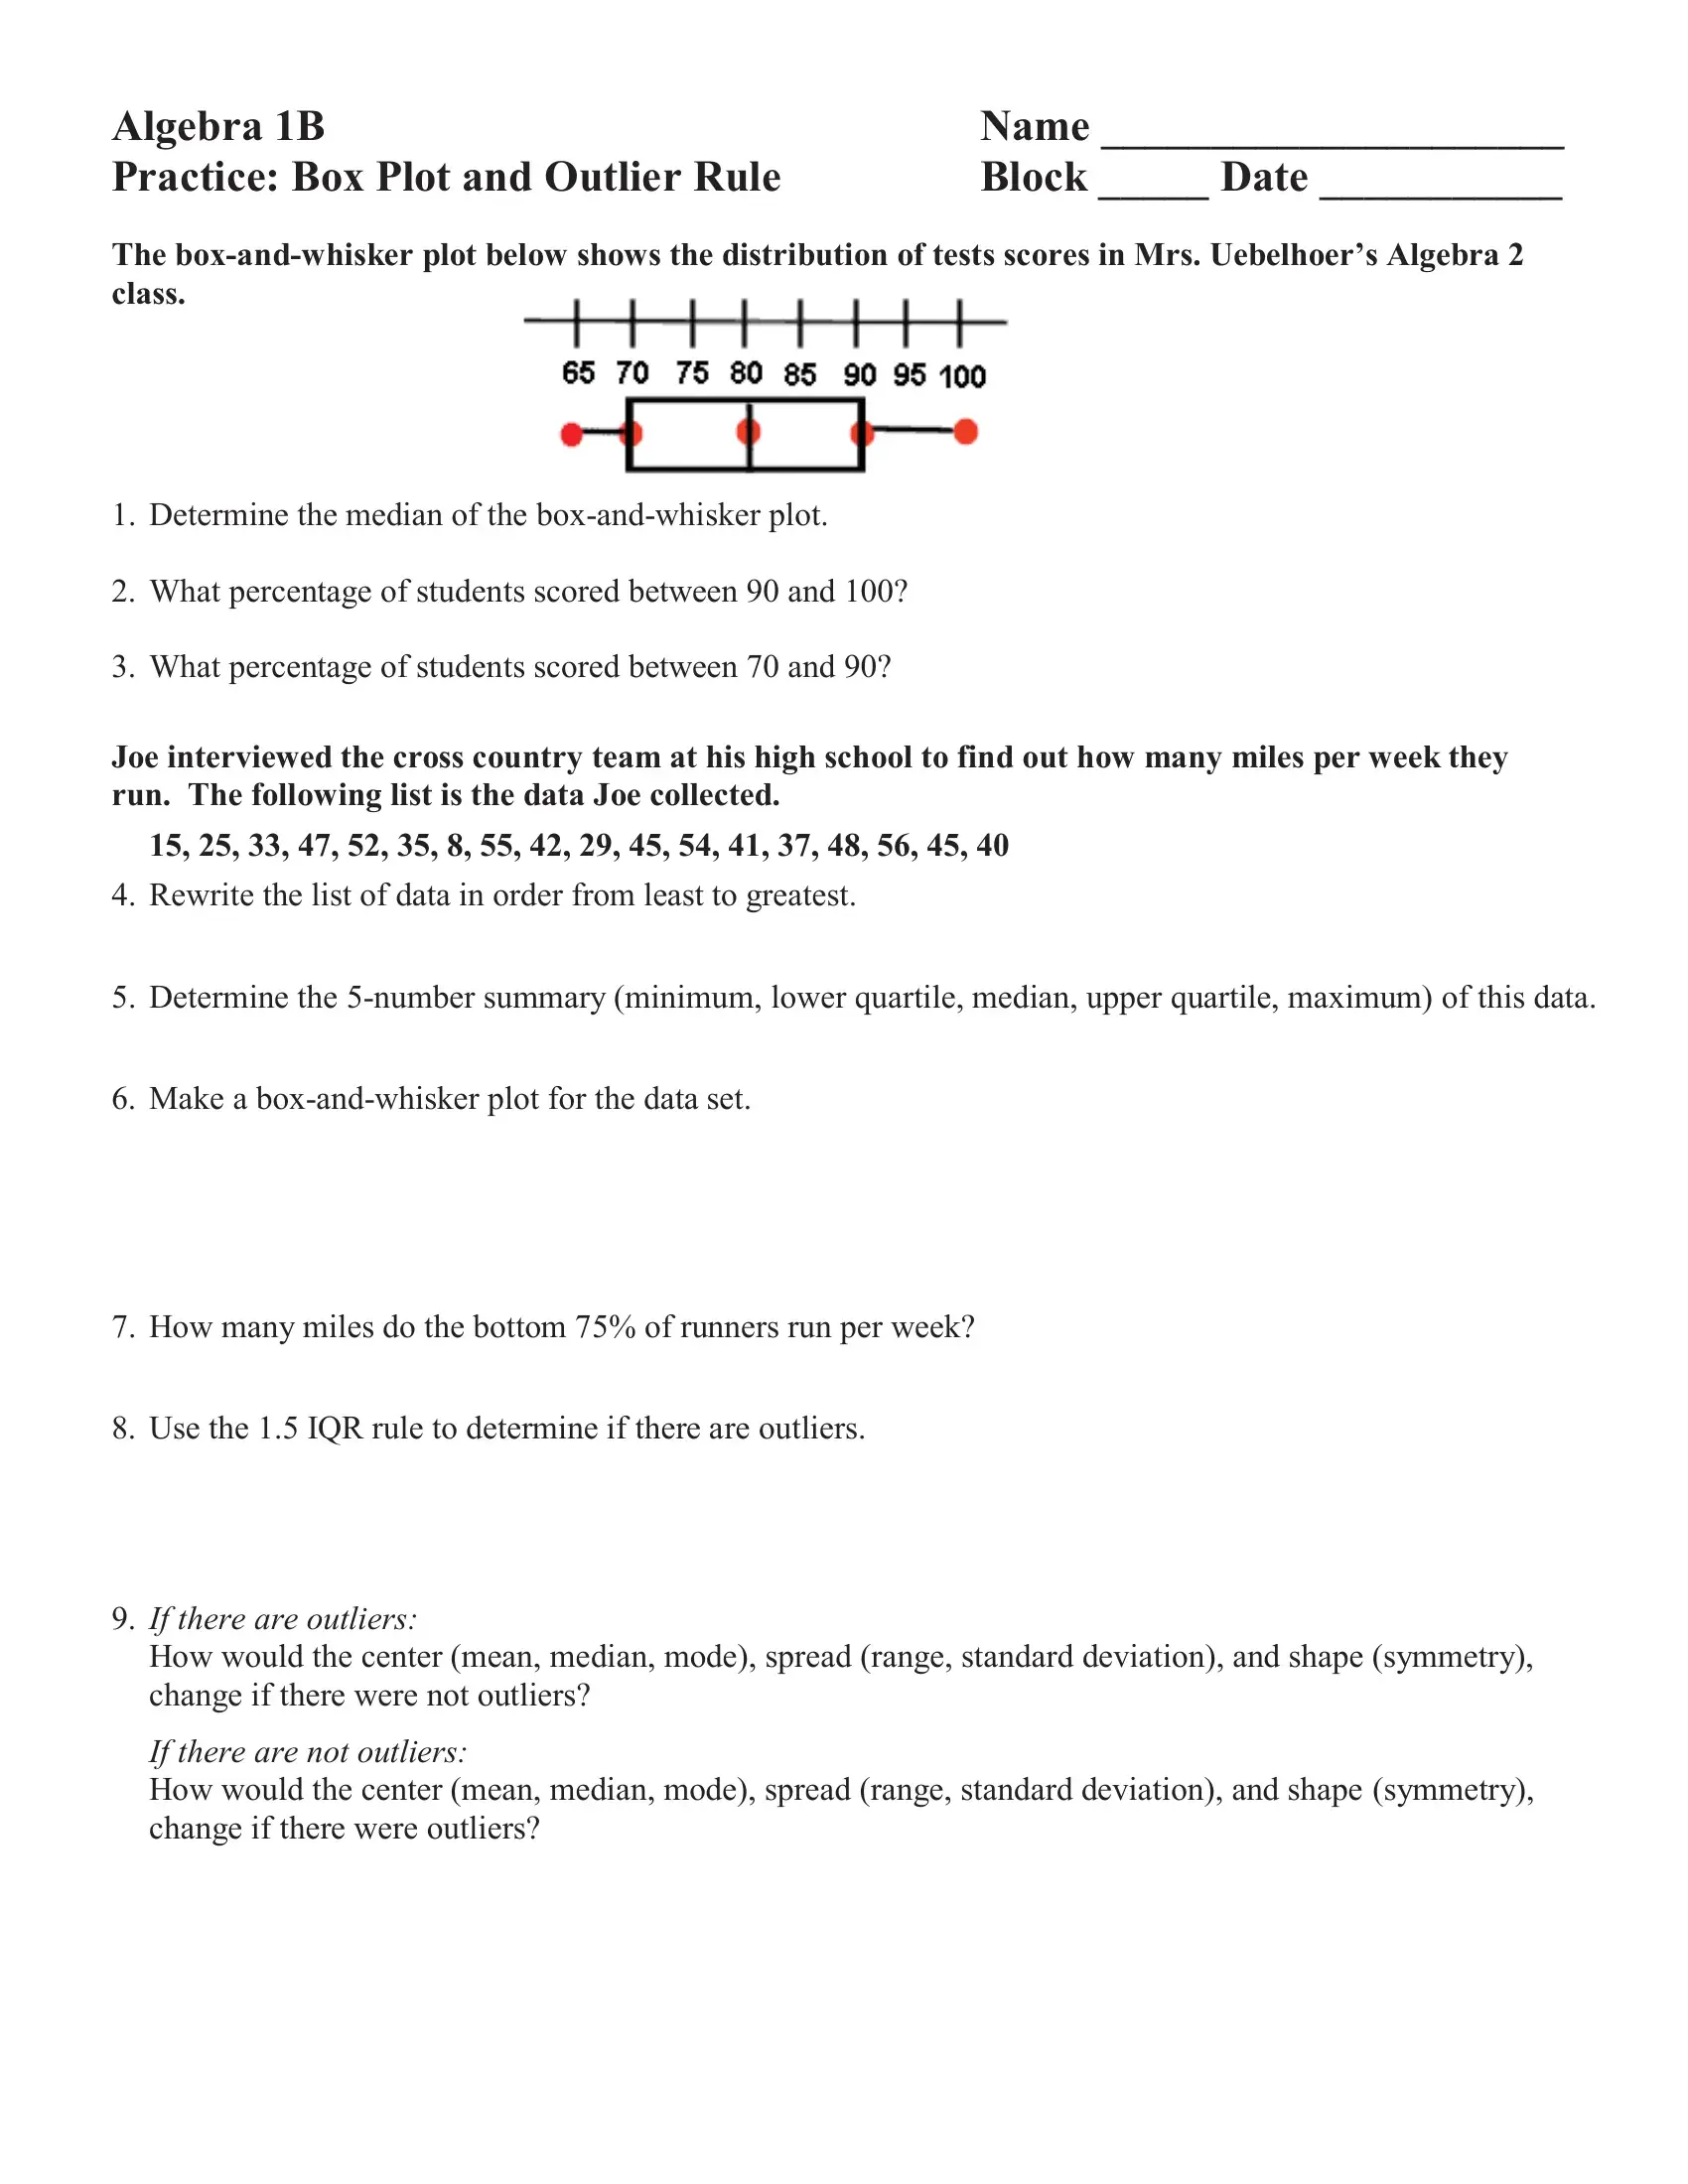
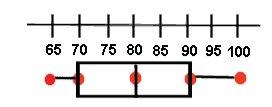
The
1.Determine the median of the
2.What percentage of students scored between 90 and 100?
3.What percentage of students scored between 70 and 90?
Joe interviewed the cross country team at his high school to find out how many miles per week they run. The following list is the data Joe collected.
15, 25, 33, 47, 52, 35, 8, 55, 42, 29, 45, 54, 41, 37, 48, 56, 45, 40
4.Rewrite the list of data in order from least to greatest.
5.Determine the
6.Make a
7.How many miles do the bottom 75% of runners run per week?
8.Use the 1.5 IQR rule to determine if there are outliers.
9.IF THERE ARE OUTLIERS:
How would the center (mean, median, mode), spread (range, standard deviation), and shape (symmetry), change if there were not outliers?
IF THERE ARE NOT OUTLIERS:
How would the center (mean, median, mode), spread (range, standard deviation), and shape (symmetry), change if there were outliers?
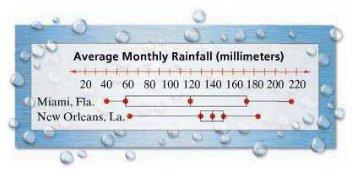
The parallel
10.a. Which city shows a greater range in average monthly rainfall?
b.Explain how the parallel
11.In Miami, what percentage of rainfall was between 60 and 216 millimeters?
12.In New Orleans, what percentage of rainfall was between 61 and 130 millimeters?
Mrs. Hagan measured the height, in inches, of all the girls in her PE class. She recorded her results in the following list.
63, 60, 67, 62, 58, 63, 68, 59, 62, 65, 56, 63, 59, 62, 58
13. Determine the
14.Between what heights are the middle 50% of the girls in Mrs. Hagan’S PE CLASS?
15.Use the 1.5 IQR rule to determine if there are outliers.
16.IF THERE ARE OUTLIERS:
How would the center (mean, median, mode), spread (range, standard deviation), and shape (symmetry), change if there were not outliers?
IF THERE ARE NOT OUTLIERS:
How would the center (mean, median, mode), spread (range, standard deviation), and shape (symmetry), change if there were outliers?