The Linear Quadratic Regression Worksheet form, tailored for Algebra 2 Honors students, serves as a versatile tool in understanding complex mathematical concepts through practical application. This form introduces students to a series of problem scenarios ranging from epidemiological studies, such as predicting the number of AIDS cases in the United States, to astronomical observations, like determining the velocity of galaxies moving away from Earth. Each problem requires the calculation of both linear and quadratic regression equations and correlation coefficients, pushing students to analyze which model best represents the given data. Additionally, the form challenges students to apply these models to predict outcomes, such as the future number of Americans over 100 years old or the concentration of medication in a patient’s blood after a specific time, thereby enhancing their analytical skills. The worksheet also provides a concise guide on using statistical plots and diagnostics on a calculator to find and interpret regression statistics, ensuring that students are not just performing calculations but also understanding the significance of their results. In this manner, the form not only strengthens students' grasp of algebraic concepts but also emphasizes their real-world applications, preparing them for more complex analyses and predictions in their academic and future professional endeavors.
| Question | Answer |
|---|---|
| Form Name | Linear Quadratic Regression Worksheet Form |
| Form Length | 3 pages |
| Fillable? | Yes |
| Fillable fields | 3 |
| Avg. time to fill out | 1 min 21 sec |
| Other names | linear and quadratic regression worksheet 1, linear equationts with quadratic form and probala, quadratic regression worksheet answer key, linear and quadratic regression worksheet |

Algebra 2 Honors |
Linear and Quadratic Regression Worksheet 1 |
|
Name ___________________________ |
Date ______________ Hour ________________ |
|
Problems
1.The table below lists the total estimated numbers of United States AIDS cases, by year of diagnosis. Find the linear and quadratic regression equations and correlation coefficients. State which model, linear or quadratic, best fits the data. Predict the number of aids cases for the year 2006.
2.The table below lists temperatures measured in Fahrenheit and Celsius. Find the linear and quadratic regression equations and correlation coefficients. State which model, linear or quadratic, best fits the data. Determine the equivalent temperature in Celsius degrees for a body temperature of 98.6 degrees Fahrenheit.
3.According to Roche Pharmaceuticals, a BMI of 30 or greater can create an increased risk of developing medical problems associated with obesity. The chart below shows the height and weight for individuals with a BMI of 30. Find the linear and quadratic regression equations and correlation coefficients. State which model, linear or quadratic, best fits the data. Determine the weight of a
4.The table below lists distances in mega parsecs and velocities for four galaxies moving rapidly away from earth. Find the linear and quadratic regression equations and correlation coefficients. State which model, linear or quadratic, best fits the data. Determine the velocity of Hydra, a galaxy located 776 mega parsecs from earth.
5.The following data represents approximate heights for a ball thrown by a

6.The concentration (in milligrams per liter) of a medication in a patient’s blood as time passes is given by the data in the following table. Find the linear and quadratic regression equations and correlation coefficients. State which model, linear or quadratic, best fits the data. What is the concentration of medicine in the blood after 4 hours have passes?
7.A ball is rolled down a hallway and its position is recorded at five different times. Use the data given in the table to find the linear and quadratic regression equations and correlation coefficients. State which model, linear or quadratic, best fits the data. Predict the location of the ball after 12 seconds.
8.Suppose you are standing in the observation deck of the CN tower in Toronto. You drop a penny. The distance of the penny from the ground after various times is given the table below. Use the data given in the table to find the linear and quadratic regression equations and correlation coefficients. State which model, linear or quadratic, best fits the data. Where is the penny located after falling for 10.5 seconds?
9.The table below lists the number of Americans (in thousands) expected to be over 100 years old for selected years. Use the data given in the table to find the linear and quadratic regression equations and correlation coefficients. State which model, linear or quadratic, best fits the data. How many Americans will be over 100 years old in the year 2008?
10.The table below shows the apparent temperature vs. relative humidity in a room whose actual temperature is 72 degrees. Use the data given in the table to find the linear and quadratic regression equations and correlation coefficients. State which model, linear or quadratic, best fits the data. Predict the apparent temperature when the relative humidity reaches 110%.

Linear and Quadratic Regression Notes
Find the best fit regression equation.
1. |
Turn on statistical plots. [2ND - STAT PLOT] |
|
2. |
Turn on Diagnostics to get correlation statistics. [CATALOG ( |
2nd - 0) - DIAGNOSTICS ON] |
3.Enter into the calculator list. [STAT – EDIT]
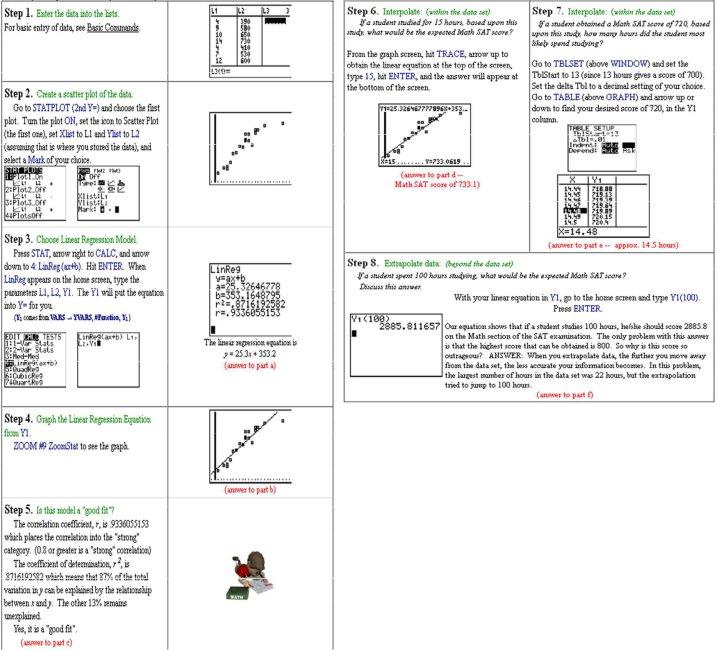
4.Calculate regression statistics. [STAT- CALC - LINREG – L1 (2nd - 1), L2 (2nd - 2), Y1 (VARS - YVARS - FUNCTION - Y1)]
5.Find r, the correlation coefficient.
6.View graph. [GRAPH]
7.Adjust window, if necessary. [ZOOM - ZOOMSTAT]
8.Repeat steps 4 through 7 except calculate regression statistics for best fit quadratic curve (use QUADREG instead for LINREG).
9.The regression that has the best r value is the equation that produces the best fit.
Example of data entry