Focusing on the importance of transparency and regulatory compliance, the SEC Cover Sheet form stands out as a crucial document for companies like Banco de Oro Unibank, Inc. In providing the SEC with essential data such as the company's full name, business address, contact information, and detailed securities information, it plays a key role in maintaining the integrity of financial reporting. Not only does the form include specifics like registration number, form type, and annual meeting dates, but it also delves into finer details like the total amount of borrowings and the number of stockholders. The inclusion of the SEC Form 17-Q, a quarterly report mandated by the Securities Regulation Code, further emphasizes the company's commitment to regulatory adherence by disclosing financials, industry classification, and the status of securities listed on stock exchanges. This comprehensive approach to filing not only meets the requirements set forth by the SEC but also assures stakeholders of the company's dedication to transparency and legal compliance.
Question | Answer |
---|---|
Form Name | Sec Cover Sheet Form |
Form Length | 18 pages |
Fillable? | No |
Fillable fields | 0 |
Avg. time to fill out | 4 min 30 sec |
Other names | cover sheet for afs 2020 excel format, cover sheet for audited financial statements, cover sheet for afs, sec cover sheet for afs 2021 excel format |
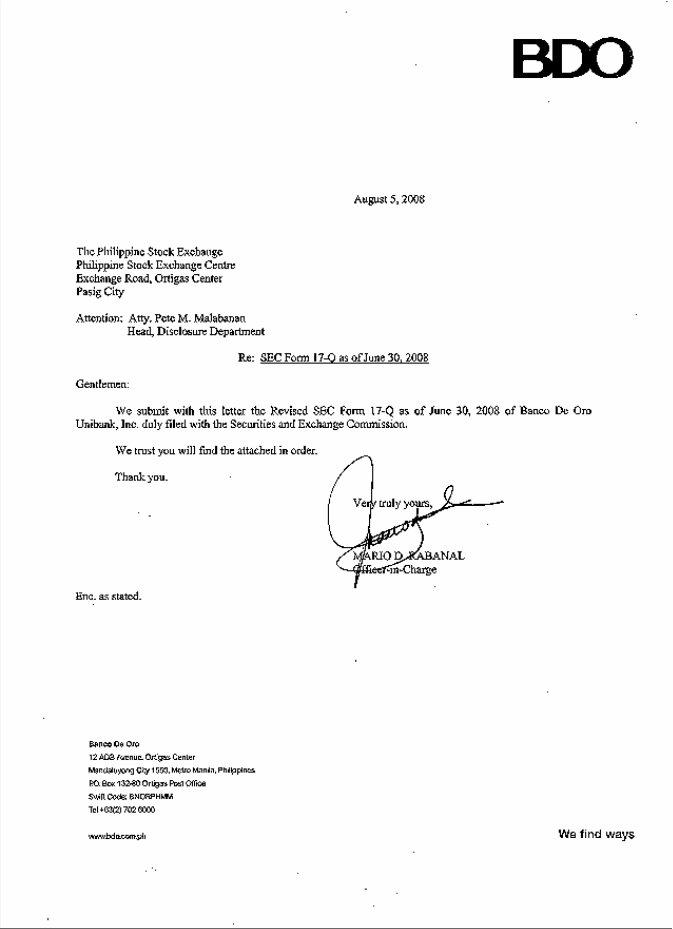
COVER SHEET
|
|
|
|
|
|
|
|
|
|
|
|
|
|
|
|
|
|
|
|
|
|
|
|
3 |
4 |
0 |
0 |
1 |
|
|
|
|
|
|
|
|
|
|
|
|
|
|
|
|
|
|
|
S.E.C. Registration Number |
|
||||||||
|
|
|
|
|
|
|
|
|
|
|
|
|
|
|
|
|
|
|
|
|
|
|
|
|
|
|
|
|
B |
A |
N |
C |
O |
|
D |
E |
|
O |
R |
O |
|
U |
N |
I |
B |
A |
N |
K |
, |
|
|
I |
N |
C |
. |
|
|
|
|
|
|
|
|
|
|
|
|
|
|
|
|
|
|
|
|
|
|
|
|
|
|
|
|
|
|
|
|
|
|
|
|
|
|
|
|
|
|
|
|
|
|
|
|
|
|
|
|
|
|
|
|
|
|
|
|
|
|
|
|
|
|
|
|
|
|
(COMPANY'S FULL NAME) |
|
|
|
|
|
|
||||||||||||
1 |
2 |
|
A |
D |
B |
|
A |
V |
E |
N |
U |
E |
|
O |
R |
T |
I |
G |
A |
S |
|
|
C |
E |
N |
T |
E |
R |
|
|
|
|
|
|
|
|
|
|
|
|
|
|
|
|
|
|
|
|
|
|
|
|
|
|
|
|
|
M |
A |
N |
D |
A |
L |
U |
Y |
O |
N |
G |
|
C |
I |
T |
Y |
|
|
|
|
|
|
|
|
|
|
|
|
|
|
|
|
|
|
|
(BUSINESS ADDRESS: NO. STREET CITY/TOWN/PROVINCE) |
|
|
|
|
|
|
ALBERTO D. REYES/RUBY A. CRUZ
Contact Person
Company Telephone Number
06
Month
3 0
Day
S E C 1 7 - Q
Form Type
0 |
5 |
|
2 |
6 |
Month Day Annual Meeting
Secondary License type, if applicable
CF
D
Dept. Requiring this Doc. |
|
|
|
|
|
Amended Articles Number/Section |
|||||||||||
|
|
|
|
|
|
|
|
|
|
|
|
|
|
|
|
|
|
14,313 |
|
|
|
|
|
|
|
Total Amount of Borrowings |
|||||||||
|
|
|
|
|
|
|
|
|
|
|
|
|
|
|
|
|
|
Total No.of Stockholders |
|
|
|
|
|
|
|
|
|
|
|
|
|
|
|||
|
|
|
|
|
|
Domestic |
|
|
|
|
|
Foreign |
|||||
|
|
|
|
|
|
|
|
|
|
|
|
|
|
|
|
|
|
To be Accomplished by SEC Personnel concerned |
|
|
|
|
|
|
|
|
|
|
|
|
|
|
|||
|
|
|
|
|
|
|
|
|
|
|
|
|
|
|
|
|
|
|
|
|
|
|
|
|
|
|
|
|
|
|
|
|
|
|
|
File Number |
|
|
|
LCU |
|
|
|
|
|
|
|
|
|
||||
|
|
|
|
|
|
|
|
|
|
|
|
|
|
|
|
|
|
|
|
|
|
|
|
|
|
|
|
|
|
|
|
|
|
|
|
Document I.D. |
|
|
|
Cashier |
|
|
|
|
|
|
|
|
|
Stamps
Remarks: Pls. Use black ink of scanning purposes
SECURITIES AND EXCHANGE COMMISSION
SEC FORM
QUARTERLY REPORT PURSUANT TO SECTION 17 OF THE SECURITIES
REGULATION CODE AND BRC RULES 17 (2) (b) THEREUNDER
1.For the quarter ended June 30, 2008.
2.Commission identification number 34001 3. BIR Tax Identification No.
BANCO DE ORO UNIBANK, INC.
4.Exact name of issuer as specified in its charter
Mandaluyong City, Philippines
5.Province, country or other jurisdiction of incorporation or organization
6. |
Industry Classification Code |
(For SEC Use Only) |
|
12 ADB Ave. Ortigas Center, Mandaluyong City |
|
7. |
Address of issuer's principal office |
Postal Code |
8.Issuer's Telephone number, including area code
NA
9.Former name, former address and former fiscal year, if changed since last report
10.Securities registered pursuant to Section 8 and 12 of the Code of Section 4 and 8
of the RSA |
|
|
|
Number of shares of |
Amount of |
Title of each class |
common stock outstanding |
Debt Outstanding |
Common stock |
2,302,032,661 |
|
11. Are any or all of the securities listed on a stock exchange? |
|
|
Yes [X] |
No. [ ] |
|
If yes, state the name of such stock exchange and the class/es of securities listed therein: Philippine Stock Exchange
12.Indicate by check mark whether the registrant:
a. has filed all reports required to be filed by Section 17 of the Code and SRC Rule 17 thereunder or Section 11 of the RSA and RSA 11
Yes [X]No. [ ]
b. has been subject to such filing requirements for the last ninety (90) days
Yes [X] |
No. [ ] |
SIGNATURES
Pursuant to the requirements of the Securities Regulation Code, the issuer has duly caused this report to be signed on its behalf by the undersigned thereunto duly authorized.
Issuer |
BANCO DE ORO UNIBANK, INC. |
Signature and Title |
LUCY CO DY |
|
EVP/COMPTROLLER |
Date |
August 01, 2008 |
Principal Financial /Accounting |
|
Officer/Comptroller |
LUCY CO DY |
Signature and Title |
|
|
EVP/COMPTROLLER |
Date |
August 01, 2008 |
SEC FORM
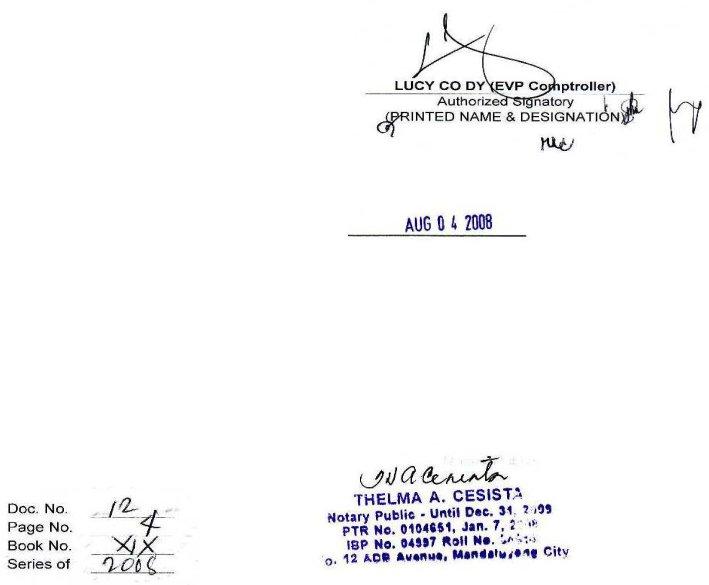
I hereby certify that all the information set forth in the above report are true and correct
of my own knowledge.
LUCY CO DY (EVP Comptroller)
Authorized Signatory
(PRINTED NAME & DESIGNATION)
REPUBLIC OF THE PHILIPPINES }
CITY OF MANDALUYONG } S.S.
SUBSCRIBED AND SWORN TO before me this _________4th_____________ day of August,
2008, the above affiant exhibiting to me his/her described Competent Evidence of Identity (“CEI”):
Name |
CEI |
Date & Place Issued |
Lucy Co Dy TT0770339 |
|
09.07.2006/Manila |
Notary Public
Doc. No.
Page No.
Book No.
Series of
*To be signed by any of the following officers pursuant to a Board Resolution filed with the Commission
1.Chief Operating Officer
2.Chief Financial Officer
3.Comptroller or Treasurer
BANCO DE ORO UNIBANK, INC. & SUBSIDIARIES 12 ADB Ave Ortigas Center, Mandaluyong City
CONDENSED STATEMENT OF CONDITION
(Amounts in Thousands of Pesos)
|
|
|
|
Audited |
|
|
As of |
|
As of |
|
|
Jun 30, 2008 |
|
Dec 31, 2007 |
RESOURCES |
|
|
|
|
CASH AND OTHER CASH ITEMS |
P |
13,990,697 |
P |
18,387,847 |
DUE FROM BANGKO SENTRAL NG PILIPINAS |
|
76,975,529 |
|
49,461,276 |
DUE FROM OTHER BANKS |
|
13,088,145 |
|
20,689,635 |
INVESTMENT SECURITIES |
|
|
|
|
At Fair Value Through Profit or Loss |
|
14,653,025 |
|
20,951,513 |
|
94,872,518 |
|
75,604,608 |
|
|
69,883,411 |
|
67,944,102 |
|
LOANS AND OTHER |
|
341,396,882 |
|
311,674,939 |
BANK PREMISES, FURNITURE, FIXTURES AND EQUIPMENT – net |
|
12,767,900 |
|
11,431,397 |
INVESTMENT PROPERTIES |
|
16,394,091 |
|
18,150,715 |
EQUITY INVESTMENTS – net |
|
1,701,686 |
|
1,694,721 |
DEFERRED TAX ASSETS |
|
5,390,824 |
|
5,592,305 |
OTHER RESOURCES - net |
|
15,550,222 |
|
15,838,418 |
TOTAL RESOURCES |
P |
676,664,930 |
P |
617,421,476 |
LIABILITIES AND CAPITAL FUNDS |
|
|
|
|
|
|
|
|
|
DEPOSIT LIABILITIES |
|
|
|
|
Demand |
P |
24,342,609 |
P |
25,164,584 |
Savings |
|
279,374,763 |
|
318,669,697 |
Time |
|
195,127,707 |
|
101,562,619 |
Total Deposit Liabilities |
|
498,845,079 |
|
445,396,900 |
BILLS PAYABLE |
|
62,181,358 |
|
52,483,249 |
SUBORDINATED NOTES PAYABLE |
|
20,145,992 |
|
18,631,298 |
OTHER LIABILITIES |
|
40,945,322 |
|
40,369,401 |
Total Liabilities |
|
622,117,751 |
|
556,880,848 |
EQUITY |
|
|
|
|
Attributable to Shareholders of the Parent Company |
|
53,881,848 |
|
59,840,386 |
Minority Interest |
|
665,331 |
|
700,242 |
Total Equity |
|
54,547,179 |
|
60,540,628 |
TOTAL LIABILITIES AND EQUITY |
P |
676,664,930 |
P |
617,421,476 |
CONTINGENT |
|
|
|
|
|
|
|
|
|
Trust department accounts |
P |
294,236,032 |
P |
274,108,205 |
Unused commercial letters of credit |
|
24,939,097 |
|
25,253,893 |
Outstanding guarantees issued |
|
4,153,716 |
|
1,409,499 |
Export L/Cs Confirmed |
|
214,161 |
|
75,131 |
Bills for collection |
|
16,642,808 |
|
9,064,716 |
Late deposits/payment received |
|
5,561,734 |
|
1,941,799 |
Others |
|
319,507,572 |
|
223,252,949 |
TOTAL CONTINGENT ACCOUNTS |
P |
665,255,120 |
P |
535,106,192 |
|
|
|
|
|
Note: This Financial Statement is in accordance with Philippine Financial Reporting Standards(PFRS)
BANCO DE ORO UNIBANK, INC. & SUBSIDIARIES 12 ADB Ave. Ortigas Center, Mandaluyong City
CONDENSED STATEMENT OF INCOME & EXPENSES
(Amounts in Thousands of Pesos Except Per Share Data)
|
|
For the |
For the |
|
For the |
|
For the |
|||
|
|
Period ended |
|
Period ended |
|
Quarter ending |
|
Quarter ending |
||
|
|
Jun 30, 2008 |
|
Jun 30, 2007 |
|
Jun 30, 2008 |
|
Jun 30, 2007 |
||
INTEREST INCOME ON |
|
|
|
|
|
|
|
|
|
|
Loans and Receivables |
P |
12,146,114 |
|
P |
10,645,444 |
|
P |
6,281,682 |
P |
4,994,289 |
Investment Securities |
|
5,557,334 |
|
|
5,775,697 |
|
|
2,759,567 |
|
2,524,464 |
Due from Other Banks |
|
1,051,838 |
|
|
1,380,780 |
|
|
515,927 |
|
770,001 |
Others |
|
348,516 |
|
|
925,979 |
|
|
138,754 |
|
882,223 |
Total Interest Income |
|
19,103,802 |
|
|
18,727,900 |
|
|
9,695,930 |
|
9,170,977 |
INTEREST EXPENSE ON |
|
|
|
|
|
|
|
|
|
|
Deposit liabilities |
|
5,956,933 |
|
|
6,377,855 |
|
|
3,002,489 |
|
3,034,603 |
Bills Payable and Others |
|
2,249,586 |
|
|
1,777,423 |
|
|
1,210,490 |
|
690,792 |
Total Interest Expense |
|
8,206,519 |
|
|
8,155,278 |
|
|
4,212,979 |
|
3,725,395 |
NET INTEREST INCOME |
|
10,897,283 |
|
|
10,572,622 |
|
|
5,482,951 |
|
5,445,582 |
|
|
|
|
|
|
|
|
|
|
|
IMPAIRMENT LOSSES |
|
1,548,027 |
|
|
3,056,432 |
|
|
678,450 |
|
2,431,199 |
NET INTEREST INCOME AFTER IMPAIRMENT LOSSES |
9,349,256 |
|
|
7,516,190 |
|
|
4,804,501 |
|
3,014,383 |
|
OTHER INCOME |
|
|
|
|
|
|
|
|
|
|
Service Charges, Fees and Commissions |
|
3,521,461 |
|
|
4,152,011 |
|
|
1,755,528 |
|
1,882,426 |
Trading Gain – net |
|
|
|
2,596,364 |
|
|
|
1,383,781 |
||
Trust Fees |
|
487,494 |
|
|
349,143 |
|
|
217,157 |
|
204,453 |
Foreign Exchange Gain/(Loss) – net |
|
2,177,244 |
|
|
469,729 |
|
|
1,188,399 |
|
90,241 |
Miscellaneous – net |
|
1,709,357 |
|
|
2,004,129 |
|
|
741,625 |
|
1,608,898 |
Total Other Income |
|
7,023,901 |
|
|
9,571,376 |
|
|
3,270,256 |
|
5,169,799 |
OTHER EXPENSES |
|
|
|
|
|
|
|
|
|
|
Employee Benefits |
|
4,688,379 |
|
|
3,697,097 |
|
|
2,728,993 |
|
1,983,337 |
Occupancy |
|
1,635,367 |
|
|
1,680,312 |
|
|
830,146 |
|
881,828 |
Taxes and licenses |
|
1,212,861 |
|
|
1,388,096 |
|
|
672,483 |
|
570,830 |
Security, Clerical, Messengerial and Janitorial |
|
719,034 |
|
|
472,835 |
|
|
379,025 |
|
235,060 |
Insurance |
|
494,382 |
|
|
506,680 |
|
|
249,335 |
|
251,432 |
Advertising |
|
367,925 |
|
|
323,673 |
|
|
179,055 |
|
176,366 |
Litigation/Assets Acquired |
|
236,968 |
|
|
300,092 |
|
|
117,665 |
|
116,070 |
Miscellaneous |
|
3,722,103 |
|
|
4,225,668 |
|
|
1,621,627 |
|
1,918,089 |
Total Other Expenses |
|
13,077,019 |
|
|
12,594,453 |
|
|
6,778,329 |
|
6,133,012 |
INCOME BEFORE TAX |
|
3,296,138 |
|
|
4,493,113 |
|
|
1,296,428 |
|
2,051,170 |
TAX EXPENSE (INCOME) |
|
890,315 |
|
|
1,256,972 |
|
|
247,504 |
|
625,409 |
|
|
|
|
|
|
|
|
|
|
|
NET INCOME AFTER TAX |
P |
2,405,823 |
|
P |
3,236,141 |
|
P |
1,048,924 |
P |
1,425,761 |
E TO: |
|
|
|
|
|
|
|
|
|
|
|
|
|
|
|
|
|
|
|
|
|
Equitable holders of the parent |
P |
2,380,081 |
|
P |
3,176,033 |
|
P |
1,034,561 |
P |
1,401,237 |
Minority Interest |
|
25,742 |
|
|
60,108 |
|
|
14,363 |
|
24,524 |
|
P |
2,405,823 |
|
P |
3,236,141 |
|
P |
1,048,924 |
P |
1,425,761 |
|
|
|
|
|
|
|
|
|
|
|
AVERAGE COMMON STOCK |
|
2,302,032 |
|
|
2,270,628 |
|
|
2,302,032 |
|
2,270,628 |
INCOME PER SHARE (See annex A) |
|
|
|
|
|
|
|
|
|
|
Basic |
|
1.03 |
|
|
1.40 |
|
|
0.45 |
|
0.62 |
Diluted |
|
1.03 |
|
|
1.38 |
|
|
0.45 |
|
0.61 |
Note: This Financial Statement is in accordance with Philippine Financial Reporting Standards(PFRS)
BANCO DE ORO UNIBANK, INC. & SUBSIDIARIES
CASH FLOW STATEMENTS
FOR THE PERIODS ENDED JUNE 30, 2008 AND 2007
(Amounts in Thousands of Pesos)
|
2008 |
2007 |
|
CASH FLOWS FROM OPERATING ACTIVITIES |
|
|
|
Income before tax |
P 3,296,137 |
|
P 4,493,113 |
Adjustments for: |
|
|
|
Interest income |
|||
Interest expense |
8,206,519 |
8,155,277 |
|
Provision for impairment losses |
1,548,027 |
3,056,432 |
|
Depreciation and amortization |
1,344,836 |
1,046,946 |
|
Fair value loss (gain) |
29,394,643 |
277,135 |
|
Amortization of deferred charges |
57,071 |
54,420 |
|
Operating loss before changes in operating |
|
|
|
resources and liabilities |
25,795,269 |
||
Decrease (increase) in financial assets at fair value |
|
|
|
through profit or loss |
5,780,738 |
||
Increase in loans and other receivables |
26,287,358 |
||
Increase in investment properties |
1,324,318 |
1,113,863 |
|
Decrease (increase) in other resources |
299,709 |
||
Increase (decrease) in deposit liabilities |
54,880,582 |
||
Increase in other liabilities |
|
5,589,137 |
|
Cash generated from (used in) operations |
21,397,401 |
29,519,464 |
|
Interest received |
18,364,080 |
18,629,728 |
|
Interest paid |
|||
Cash paid for income tax |
|
||
Net Cash From (Used in) Operating Activities |
31,454,305 |
37,396,708 |
|
CASH FLOWS FROM INVESTING ACTIVITIES |
|
|
|
Net acquisitions of bank premises, furniture, |
|
|
|
fixtures and equipment |
|||
Net decrease (increase) in equity investment |
|||
Net decrease (increase) in |
572,912 |
29,333,072 |
|
Increase in |
|||
Dividends received |
|
|
|
Trust account deposit under escrow |
|
|
|
Net Cash From (Used in) Investing Activities |
10,929,386 |
||
CASH FLOWS FROM FINANCING ACTIVITIES |
|
|
|
Proceeds from issuance of common shares |
0 |
0 |
|
Net proceeds from (payments of) bills payable |
8,963,217 |
||
Sale (acquisition) of treasury stock |
0 |
1,428,104 |
|
Dividends paid |
0 |
|
0 |
Net Cash From (Used in) Financing Activities |
8,963,217 |
||
NET INCREASE IN CASH |
|
|
|
AND CASH EQUIVALENTS (Carried Forward) |
15,515,613 |
28,659,848 |
|
CASH AND CASH EQUIVALENTS AT BEGINNING OF YEAR |
|
|
|
Cash and other cash items |
18,387,847 |
17,905,035 |
|
Due from Bangko Sentral ng Pilipinas |
49,461,276 |
42,236,370 |
|
Due from other banks |
20,689,635 |
|
12,834,782 |
|
88,538,758 |
72,976,187 |
|
CASH AND CASH EQUIVALENTS AT END OF YEAR |
|
|
|
Cash and other cash items |
13,990,697 |
10,188,565 |
|
Due from Bangko Sentral ng Pilipinas |
76,975,529 |
68,945,128 |
|
Due from other banks |
13,088,145 |
|
22,502,342 |
|
104,054,371 |
101,636,035 |
|
|
|
|
|
BANCO DE ORO UNIBANK, INC. & SUBSIDIARIES 12 ADB Ave. Ortigas Center, Mandaluyong City
STATEMENT OF CHANGES IN EQUITY
COMPARATIVE PERIODS ENDED June 30, 2008 & 2007
(Amounts in Thousands of Pesos)
|
|
Jun 30, 2008 |
|
Jun 30, 2007 |
CAPITAL STOCK |
|
|
|
|
Balance end of Qtr. June |
P |
23,020,328 |
P |
22,706,293 |
COMMON STOCK OPTION |
|
|
|
|
|
|
|
|
|
Balance end of Qtr. June |
P |
76,280 |
P |
28,914 |
Treasury Shares – At Cost |
|
|
|
|
|
|
|
|
|
Balance end of Qtr. June |
P |
0 |
P |
|
ADDITIONAL PAID IN CAPITAL |
|
|
|
|
|
|
|
|
|
Balance beginning |
P |
15,936,419 |
P |
15,694,692 |
Auditor's adjusting entries |
|
|
||
Balance end of Qtr. June |
P |
15,810,286 |
P |
14,981,574 |
SURPLUS RESERVES |
|
|
|
|
|
|
|
|
|
Balance beginning |
P |
1,051,041 |
P |
830,119 |
Transfer from Surplus Free |
|
24,000 |
|
24,000 |
Auditor's adjusting entries |
|
|
104,753 |
|
Balance end of Qtr. June |
P |
1,050,117 |
P |
958,872 |
SURPLUS FREE |
|
|
|
|
|
|
|
|
|
Balance beginning |
P |
15,774,884 |
P |
10,729,117 |
Net Income |
|
2,405,823 |
|
3,236,141 |
Transfer to Surplus Reserves |
|
|
||
Declaration of Cash Dividends |
|
|
||
Auditor's adjusting entries |
|
136,654 |
|
977,758 |
Balance end of Qtr. June |
P |
16,451,735 |
P |
14,149,398 |
ACCUMULATED TRANSLATION ADJUSTMENT |
|
|
|
|
|
|
|
|
|
Balance end of Qtr. June |
P |
P |
||
APPRAISAL INCREMENT RESERVES |
|
|
|
|
|
|
|
|
|
Balance end of Qtr. June |
P |
1,363,072 |
P |
1,361,952 |
UNREALIZED DECLINE IN VALUE OF ASS |
|
|
|
|
|
|
|
|
|
Balance end of Qtr. June |
P |
P |
2,336,375 |
|
|
|
|
|
|
MINORITY INTEREST |
P |
665,331 |
P |
953,383 |
|
|
|
|
|
TOTAL EQUITY |
P |
54,547,179 P |
57,472,205 |
|
|
|
|
|
|
BANCO DE ORO UNIBANK, INC. & SUBSIDIARIES 12 ABD Ave. Ortigas Center, Mandaluyong City
AGING OF LOANS AND ACCOUNTS RECEIVABLE
As of June 30, 2008
(Amounts in Thousands of Pesos)
|
|
|
|
|
|
|
|
|
|
|
|
|
|
|
|
TYPE OF ACCOUNTS |
|
CURRENT |
|
61 – 180 DAYS |
|
181 - 360 DAYS |
|
OVER 360 DAYS |
|
ITEMS IN |
|
TOTAL |
|
|
|
|
|
|
|
LITIGATION |
|
|
||||||
|
|
|
|
|
|
|
|
|
|
|
|
|
|
|
|
|
|
|
|
|
|
|
|
|
|
|
|
|
|
|
A. INTERBANK CALL LOANS RECEIVABLES |
P |
22,442,629 |
P |
0 |
P |
0 |
P |
0 |
P |
0 |
P |
22,442,629 |
|
|
Interbank Call Loan |
|
3,076,133 |
|
|
|
|
|
|
|
|
|
3,076,133 |
|
|
Interbank Call Loan |
|
4,490 |
|
|
|
|
|
|
|
|
|
4,490 |
|
|
Interbank Call Loan Receivable Fcdu(Fx |
|
19,362,006 |
|
|
|
|
|
|
|
|
|
19,362,006 |
|
|
|
|
|
|
|
|
|
|
|
|
|
|
|
|
|
B. LOANS AND RECEIVABLES |
P |
312,574,250 |
P |
6,285,193 |
P |
2,680,907 |
P |
12,490,129 |
P |
2,073,412 |
P |
336,103,891 |
|
|
Loans & Discounts |
|
218,942,817 |
|
3,574,043 |
|
744,757 |
|
4,260,162 |
|
1,771,274 |
|
229,293,053 |
|
|
|
27,628,400 |
|
286,340 |
|
70,042 |
|
1,092,098 |
|
93,400 |
|
29,170,280 |
|
|
|
Development Incentive Loans |
|
346,504 |
|
13,290 |
|
31,665 |
|
17,808 |
|
17,062 |
|
426,329 |
|
|
Bills Purchases |
|
14,262,741 |
|
19,810 |
|
0 |
|
16,147 |
|
1,817 |
|
14,300,515 |
|
|
Customers Liability on draft under LC/TR |
|
25,444,146 |
|
174,066 |
|
339,938 |
|
2,637,208 |
|
65,714 |
|
28,661,072 |
|
|
Customers Liability for this bank's acceptances |
|
2,938,469 |
|
0 |
|
0 |
|
0 |
|
0 |
|
2,938,469 |
|
|
Credit Card Receivables |
|
11,066,829 |
|
1,029,041 |
|
946,792 |
|
491,004 |
|
0 |
|
13,533,666 |
|
|
Restructured Loans |
|
686,831 |
|
1,153,908 |
|
534,172 |
|
3,672,148 |
|
107,397 |
|
6,154,456 |
|
|
Other Loan & Receivables |
|
3,778,422 |
|
34,695 |
|
13,541 |
|
303,554 |
|
16,748 |
|
4,146,960 |
|
|
Reverse Repurchase Agreement |
|
7,479,091 |
|
0 |
|
0 |
|
0 |
|
0 |
|
7,479,091 |
|
|
|
|
|
|
|
|
|
|
|
|
|
|
|
|
|
C. ACCOUNTS RECEIVABLE |
P |
4,411,979 |
P |
32,338 |
P |
89,506 |
P |
196,004 |
P |
337 |
P |
4,730,164 |
|
|
|
|
|
|
|
|
|
|
|
|
|
|
|
|
|
TOTAL |
P |
339,428,858 |
P |
6,317,531 |
P |
2,770,413 |
P |
12,686,133 |
P |
2,073,749 |
P |
363,276,684 |
|
|
|
|
|
|
|
|
|
|
|
|
|
|
|
|
Annex A
BANCO DE ORO UNIBANK, INC. & SUBSIDIARIES 12 ABD Ave. Ortigas Center, Mandaluyong City
COMPUTATION OF WEIGHTED NUMBER OF COMMON SHARES
(Amounts in Thousands of Pesos Except Per Share Data)
NO. OF SHARES – COMMON |
|
|
Balance of |
Average Number of |
|
As of June |
|
Common Shares |
Common Shares |
||
January 2007 |
|
|
2,270,628 |
|
|
February 2007 |
|
|
2,270,628 |
|
|
March 2007 |
|
|
2,270,628 |
|
|
April 2007 |
|
|
2,270,628 |
|
|
May 2007 |
|
|
2,270,628 |
|
|
June 2007 |
|
|
2,270,628 |
|
2,270,628 |
|
|
|
|
|
|
Weighted Average |
|
|
|
|
2,270,628 |
Basic Earnings per share |
|
|
|
|
|
Consolidated Net Income |
|
|
|
|
3,176,033 |
Divided by the weighted average number of |
|
|
|
|
|
outstanding common shares |
|
|
|
|
2,270,628 |
Basic Earnings per share |
|
|
|
|
1.40 |
|
|
|
|
|
|
Diluted Earnings Per Share |
|
|
|
|
1.38 |
January 2008 |
|
|
2,302,032 |
|
|
|
|
|
|
||
February 2008 |
|
|
2,302,032 |
|
|
March 2008 |
|
|
2,302,032 |
|
|
April 2008 |
|
|
2,302,032 |
|
|
May 2008 |
|
|
2,302,032 |
|
|
June 2008 |
|
|
2,302,032 |
|
2,302,032 |
|
|
|
|
|
|
Weighted Average |
|
|
|
|
2,302,032 |
Basic Earnings per share |
|
|
|
|
|
Consolidated Net Income for the |
|
|
2,380,081 |
||
Divided by the weighted average number of |
|
|
|
|
|
outstanding common shares |
|
|
|
|
2,302,032 |
Basic Earnings per share |
|
|
|
|
1.03 |
Diluted Earnings Per Share |
|
|
|
|
|
|
|
|
|
|
|
Consolidated Net Income for the |
|
|
2,380,081 |
||
Total Consolidated net income for DEPS computation |
|
|
|
|
2,380,081 |
Weighted Average number of outstanding common shares |
|
|
2,302,032 |
|
2,302,032 |
Add: Amount of Grant |
|
|
52,200 |
|
|
Stock Grant |
|
|
|
|
|
Average amount of grant |
|
|
26,100 |
|
|
Average market price of BDO Shares (P103.50/2) |
|
|
51.75 |
|
504 |
Stock Options |
|
|
|
|
|
Stock Grant |
|
|
504.35 |
|
|
|
X |
10.00 |
|
5,044 |
|
Total number of share to be issued |
|
|
|
|
5,548 |
Treasury Shares (5,044x29/51.75) |
|
|
2,827 |
|
|
Potential Common Shares from assumed conversion |
|
|
|
|
|
of stock option plan |
|
|
|
|
2,721 |
Total weighted average Common Shares after conversion |
|
|
|
|
2,304,753 |
Diluted Earnings Per Share |
|
|
|
|
1.03 |
|
|
|
|
|
|
CHECKLIST OF REQUIRED DISCLOSURES
BANCO DE ORO UNIBANK, INC.
For the six months ended: June 30, 2008
FINANCIAL INFORMATION
6.Disclosure that the issuer's interim financial report is in compliance with generally accepted accounting principles.
The Bank's interim financial statements are in compliance with Philippine Financial Reporting Standards.
7.a A statement that the same accounting policies and methods of computation are followed in the interim financial statements as compared with the most recent annual financial statements or, if those policies or methods have been changed, a description of the nature and effect of the change.
The Bank used the same accounting policies and methods of computation for the interim and latest annual financial statements.
7.b Explanatory comments about the seasonality or cyclicality of interim operations.
Remarks: There is no seasonality or cyclicality in the Bank’s operations.
7.c The nature and amount of items affecting assets, liabilities, equity, net income, or cash flows that are unusual because of their nature, size or incidents.
7.d
7.e
The Bank issued and repaid several debt securities during the first semester. The details are disclosed in Section 7.e of this report.
The Bank booked
The nature and amount of changes in estimates of amounts reported in prior interim periods of the current financial year or changes in estimates of amounts reported in prior financial years, if those changes have a material effect in the current interim period.
Remarks: NONE
Issuances, repurchases, and repayments of debt and equity securities.
In February 2008, the Bank settled $100M
On May 30, 2008, the Bank issued P10.0B in unsecured subordinated debt eligible as Lower Tier 2 Capital. This issue supported BDO’s business expansion and refinanced the Bank’s existing dollar denominated Lower Tier 2 debt.
On June 30, the Bank settled its $200M Lower Tier 2 Unsecured Subordinated Notes.
7.f Dividends paid (aggregate or per share) separately for ordinary shares and other shares
On April 8, 2008, the Bank paid P0.80 per share cash dividends.
7.g Segment revenue and segment result for business segments or geographical segments whichever is the issuer’s primary basis of segment reporting. (This shall be provided only if the issuer is required to disclose segment information in its annual financial statements).
Remarks: NONE. The Bank does not yet report quarterly revenues and expenses by business segment.
7.h Material events subsequent to the end of the interim period that have not been reflected in the financial statements for the interim period.
Remarks: NONE
7.i The effect of changes in the composition of the issuer during the interim period, including business combinations, acquisition or disposal of subsidiaries and
Remarks: NONE
7.j Changes in contingent liabilities or contingent assets from December 31,2007.
Total Contingent Accounts went up by 24% to P665.255B due to the following:
Trust Department Accounts increased by 7% to P294.236B from higher levels of funds managed.
Outstanding Guarantees Issued and Export L/Cs Confirmed grew by 195% and 185% to P4.154B and P214M, respectively, on account of higher volume of trade transactions.
Bills for Collection was increased by 84% to P16.643B from increased levels of bills, drafts and checks sent for collection.
Late Deposit / Payments Received was up by 186% to P5.562B as more transactions were received from clients after clearing
Other Contingent Accounts expanded by 43% to P319.508B primarily owing to higher volume of spot, forward and swap transactions.
ISCUSSION & ANALYSIS
I.Balance Sheet – June 2008 vs. December 2007
Total Resources expanded by 10% to P676.665B from a growth in liquid assets funded by an increase in Total Deposits.
Cash and Other Cash Items went down by 24% to P13.991B to maximize earnings on reserve assets. Additionally, the
Due from BSP account accordingly increased by 56% to P76.976B, coming from the Bank’s cash account as well as additional reserves from a higher level of deposits.
Due from Other Banks declined by 37% to P13.088B owing to lower levels of foreign currency denominated placements and working balances with correspondent banks.
Investment Securities grew by 9% to P179.409B.
Net Loans and Other Receivables went up by 10% to P341.397B from a 41% increase in interbank loans and an 8% growth in gross receivables from customers as the Bank continued to expand its corporate and consumer loan portfolios.
Bank Premises rose by 12% to P12.768B on account of expenditures related to head office renovations, conversion of former EPCI branches, and investments in new equipment in anticipation of higher business volumes.
Investment Properties declined by 10% to P16.394B, owing to the Bank’s ROPA disposal programs.
Total Deposit Liabilities grew by 12% to P498.845B from an increase in low cost deposits owing to continued deposit marketing efforts. Savings Deposits declined by 12% as the Bank started to convert its
Bills Payable also increased by 18% to P62.181B on account of higher levels of interbank borrowings to support earning assets growth.
Subordinated Notes Payable increased by 8% to P20.146B as the Bank issued P10.0B worth of Lower Tier 2 Capital and redeemed a previous $200M Lower Tier 2 issue.
Capital Funds went down by 10% to P54.547B, despite the Bank’s profit for the first half of the year. The decline is attributable to the payment of cash dividends in April as well as unrealized losses on AFS Securities
II. Balance Sheet – June 2008 vs. June 2007
Total Resources grew by 12% from an expansion in the Bank’s investment securities and loan portfolios, funded by deposits and other borrowings.
Cash and Other Cash Items as well as Due from BSP increased by 37% and 12%, respectively, on account of growth in deposit levels.
Due from Other Banks went down by 42%, due to lower levels of foreign currency denominated placements and working balances with foreign banks.
Investment Securities rose by 9% from a growth in AFS and
Net Loans and Other Receivables grew by 24% as gross customer receivables expanded by 24% from sustained loan marketing efforts, and Securities Purchased Under Reverse Repurchase Agreements went up 96%.
Bank Premises went up by 9% owing to investments related to head office renovations, EPCI branch conversions and investments in new equipment.
Equity Investments declined by 26% to P1.702B due to additional allowance for impairment and the sale of certain
Deferred Tax Assets dropped by 12% to P5.391B following the
Other Resources went down by 42% primarily owing to the sale of the Bank’s special purpose subsidiary, Onshore Strategic Assets, Inc.
Total Deposit Liabilities grew 9% from continued deposit marketing efforts. Savings Deposits dropped by 12% as the Bank started to convert its
Bills Payable likewise increased by 58% to support the expansion of earning assets.
Subordinated Notes Payable doubled from the two P10.0B issues of Lower Tier 2 Notes and the redemption of the Bank’s $200M Lower Tier 2 Debt.
Capital Funds slid 5% as the Bank’s bottomline profits were offset by unrealized losses on AFS Securities.
III. Income Statement – June 2008 vs. June 2007
Net Income attributable to Equity holders of the Parent Company went down by 25%, registering at P2.380B for the first half of 2008 owing to unfavorable revaluation of the Bank’s trading and investment portfolios.
Net Interest Income (NII) increased by 3% to P10.897B primarily owing to an expansion in the Bank’s investment and loan portfolios as well as an improvement in its deposit funding mix.
Provision for Impairment Loss was 49% lower at P1.548B after booking substantial provisions last year.
Other Income declined by 27% to P7.024B due to the following:
Trading Loss for the first half of the year stood at P872M versus a gain of P2.596B for the same period the previous year. This is owing to market volatility resulting in unfavorable revaluation of the Bank’s trading and investment portfolios.
Service Charges and Fees also went down by 15% to P3.521B primarily owing to sizeable
87M on a larger portfolio of assets managed.
Foreign Exchange Gain surged 364% to P2.177B primarily due to treasury trading activities, and increased volume of interbank swaps, trade transactions and OFW remittances.
Miscellaneous Income was down by 15% to P1.709B on account of a
Operating Expenses was slightly up by 4% to P13.077B owing to the following:
Employee Benefits increased 27% from a higher manpower count brought about by business expansion.
Taxes and Licenses decreased by 13% as the previous year’s level included the settlement of previous years’ assessments.
Security, Clerical, Messengerial & Janitorial expenditures grew by 52% primarily owing to business expansion, branch conversions and growth in other fixed assets.
Advertising expenses was up 14% due to rebranding and advertising activities.
Litigation/Assets Acquired expenses declined by 21% after considerable
Miscellaneous Expenses also dropped 12% mainly owing to lower expenses related to repairs and maintenance, representation, as well as management and other professional fees.
1.Discussion of the company’s and its
2Q2008 2Q2007 Inc/(Dec)
1.) Return on Average Equity (Annualized)
Net Income / Average Total Capital Account
2,380,081 |
/ |
57,543,904 |
8.27% |
|
3,176,033 |
/ |
54,946,644 |
11.56% |
(3.29%) |
2.) Return on Average Assets (Annualized) |
|
|
||
Net Income / Average Total Assets |
|
|
||
2,380,081 |
/ |
647,043,203 |
0.74% |
|
3,176,033 |
/ |
617,404,498 |
1.03% |
(0.29%) |
3.) Net Interest Margin (Annualized) |
|
|
||
Net Interest Income / Average Earning Assets |
|
|
||
10,897,282 |
/ 566,454,166 |
3.85% |
|
|
10,572,662 |
/ 531,572,982 |
3.98% |
(0.13%) |
4.) Capital Adequacy Ratio (covering credit and market risk)
Total Qualifying Capital / Total Risk Weighted Assets
67,764,515 |
/ 460,495,036 |
14.72% |
|
57,314,804 |
/ 367,486,556 |
15.60% |
(0.88%) |
67,764,515 |
/ 512,699,473* |
13.22% |
|
*includes operational risk
5.) Basic Earnings per Share |
|
|
Net Income / Average Common Stock |
|
|
2,380,081 / 2,302,032 |
1.03 |
|
3,176,033 / 2,270,628 |
1.40 |
(0.37) |
2.1.)
2.)
3.)
4.)
5.)
Annualized return on average equity (ROE) was down by 3.29% on account of the lower bottomline profits and a broader average capital base.
Annualized return on average assets (ROA) declined by 0.29% from the lower Net Income.
Annualized Net Interest Margin slightly decreased by 0.13% owing to the lag effect of loan repricing
Capital Adequacy Ratio (CAR), covering only credit and market risk, fell 0.88% as the increase in qualifying capital was outpaced by the growth in
Basic Earnings per Share was down by P0.37 to due to the lower bottomline profits.
3.a Any known trends, demands, commitments, events or uncertainties that will have a material impact on the issuer’s liquidity.
Remarks: NONE
3.b Any events that will trigger direct or contingent financial obligation that is material to the company, including any default or acceleration of an obligation.
Remarks: NONE
3.c Any material
Remarks: NONE
3.d Any material commitments for capital expenditures, the general purpose of such commitments and the expected sources of funds for such expenditures.
The Bank expects to incur capital expenditures related to head office renovations and upgrading of IT systems. Funding will be sourced internally.
3.e Any known trends, events or uncertainties that have had or that are reasonably expected to have a material favorable or unfavorable impact on net sales/revenues/income from continuing operations.
Remarks: NONE
3.f Any significant elements of income or loss that did not arise from the issuer’s continuing operations.
The Bank booked
3.g The causes for any material change from period to period which shall include vertical and horizontal analyses of any material item;
The term “material” in this section shall refer to changes of items amounting to five percent (5%) of the relevant accounts or such lower amount, which the registrant deems material on the basis of other factors.
Vertical
I.Balance Sheet – June 2008 vs. December 2007
Savings Deposits as a percentage of Total Deposits dropped to 56% from 71.5% as the Bank started to convert its
II. Balance Sheet – June 2008 vs. June 2007
Savings Deposits as a portion of Total Deposits dropped to 56% from 69.1% as the Bank started to convert its
III. Income Statement – June 2008 vs. June 2007
Interest Income on Loans and Other Receivable grew to 63.6% of Total Interest Income from 56.8%, due to a significant expansion of the Bank’s loan portfolio.
Interest Expense on Deposits as a portion of Total Interest Expense dropped to 72.6% from 78.2%, as the Bank reduced its dependence on high cost deposits.
Interest Expense on Bills Payable and Other Liabilities increased to 27.4% of Total Interest Expense form 21.8%, primarily owing to the two P10.0B issues of Lower Tier 2 Notes.
Provision for Impairment Losses as a percentage of Net Interest Income went down to 14.2% from 28.9% after booking substantial provisions last year.
Trading gain as a percentage of Other Income dropped to
Service Charges & Fees rose to 50.1% from 43.4% of Other Income owing to a lower level of Other Income
FX Gain to Other Income surged to 31.0% from 4.9% on account of increased volume of treasury trading activities, interbank swaps, trade transactions and OFW remittances.
Employee Benefits as a portion Operating Expenses increased from 29.4% to 35.9%, owing to a higher manpower count brought about by business expansion.
Miscellaneous Expenses dropped to 28.5% of Operating Expenses from 33.6%, from lower expenditures for repairs and maintenance, representation, as well as management and other professional fees.
3.h Any seasonal aspects that had a material effect on the financial condition or results of operations.
Remarks: NONE