GRAPHING PERIODIC TRENDS
STANDARD: Students know how to use the periodic table to identify trends in ionization energy, electronegativity, and the relative sizes of ions and atoms.
PRE-LAB DISCUSSION:
The Periodic Table is arranged according to the Periodic Law. The Periodic Law states that when elements are arranged in order of increasing atomic number, their physical and chemical properties show a periodic pattern. Students can discover these patterns by examining the changes in properties of elements on the Periodic Table. The properties that will be examined in this lesson are: atomic radius AND first ionization energy
PURPOSE:
To understand periodic trends relating to atomic radius, ionization energy, and electronegativity.
PROCEDURE:
Use the information in these tables to complete the graph as described below.
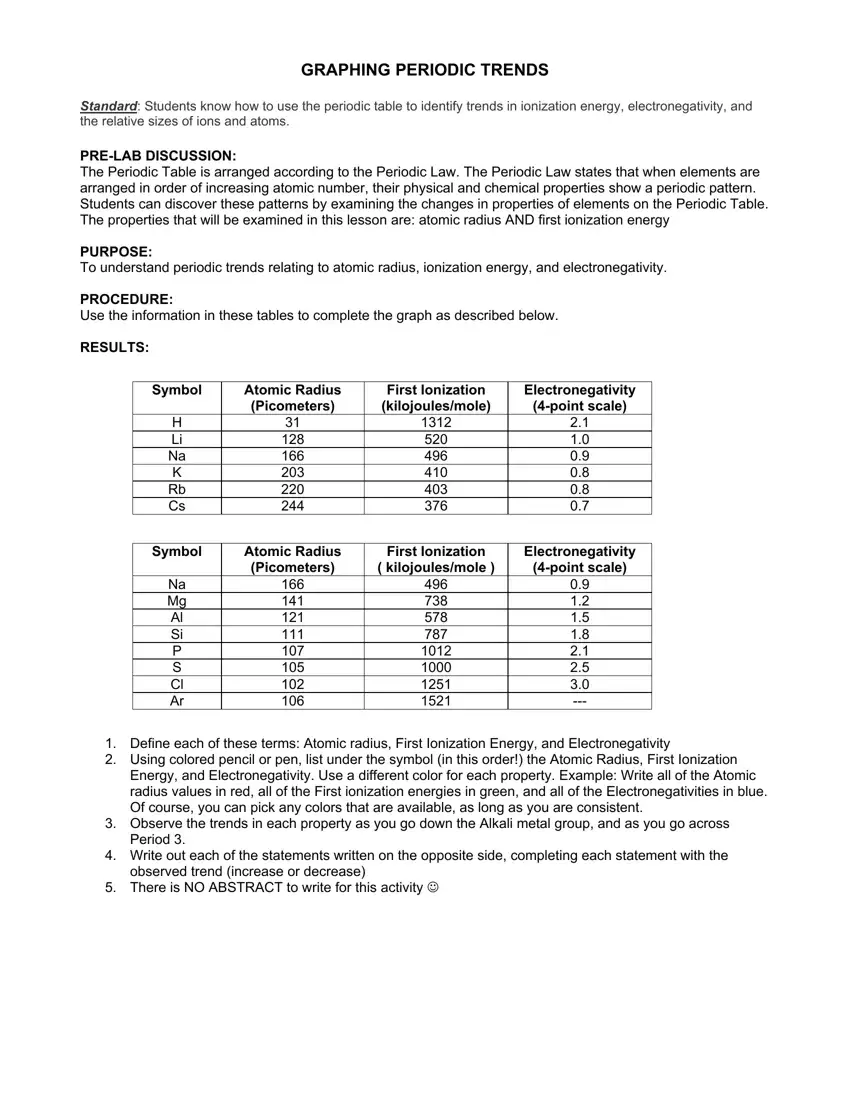
RESULTS:
Symbol |
Atomic Radius |
First Ionization |
Electronegativity |
|
(Picometers) |
(kilojoules/mole) |
(4-point scale) |
H |
31 |
1312 |
2.1 |
Li |
128 |
520 |
1.0 |
Na |
166 |
496 |
0.9 |
K |
203 |
410 |
0.8 |
Rb |
220 |
403 |
0.8 |
Cs |
244 |
376 |
0.7 |
Symbol |
Atomic Radius |
First Ionization |
Electronegativity |
|
(Picometers) |
( kilojoules/mole ) |
(4-point scale) |
Na |
166 |
496 |
0.9 |
Mg |
141 |
738 |
1.2 |
Al |
121 |
578 |
1.5 |
Si |
111 |
787 |
1.8 |
P |
107 |
1012 |
2.1 |
S |
105 |
1000 |
2.5 |
Cl |
102 |
1251 |
3.0 |
Ar |
106 |
1521 |
--- |
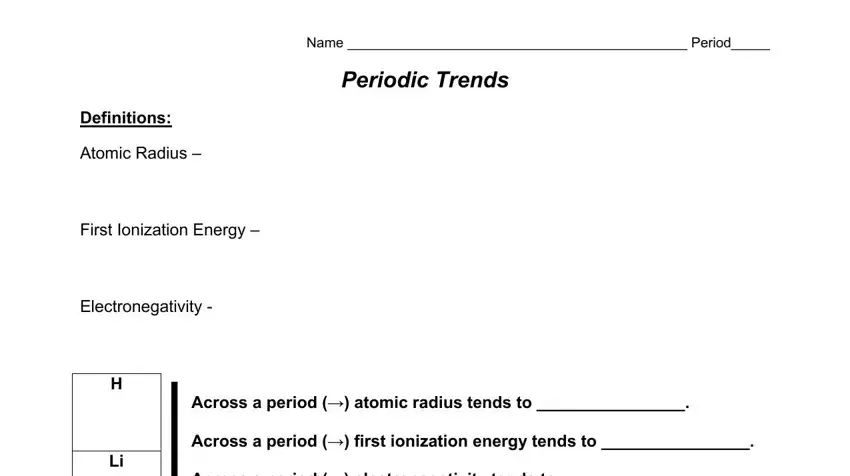
1.Define each of these terms: Atomic radius, First Ionization Energy, and Electronegativity
2.Using colored pencil or pen, list under the symbol (in this order!) the Atomic Radius, First Ionization Energy, and Electronegativity. Use a different color for each property. Example: Write all of the Atomic radius values in red, all of the First ionization energies in green, and all of the Electronegativities in blue. Of course, you can pick any colors that are available, as long as you are consistent.
3.Observe the trends in each property as you go down the Alkali metal group, and as you go across Period 3.
4.Write out each of the statements written on the opposite side, completing each statement with the observed trend (increase or decrease)
5.There is NO ABSTRACT to write for this activity ☺
Name ____________________________________________ Period_____
PERIODIC TRENDS
Definitions:
Atomic Radius –
First Ionization Energy –
Electronegativity -
H |
Across a period (ĺ) atomic radius tends to ________________. |
|
|
|
|
Across a period (ĺ) first ionization energy tends to ________________. |
Li |
Across a period (ĺ) electronegativity tends to ________________. |
|
|
|
|
|
|
|
|
|
|
|
|
Na |
Mg |
Al |
Si |
P |
S |
Cl |
|
Ar |
166 |
|
|
|
|
|
|
|
|
496 |
|
|
|
|
|
|
|
|
0.9 |
|
|
|
|
|
|
|
|
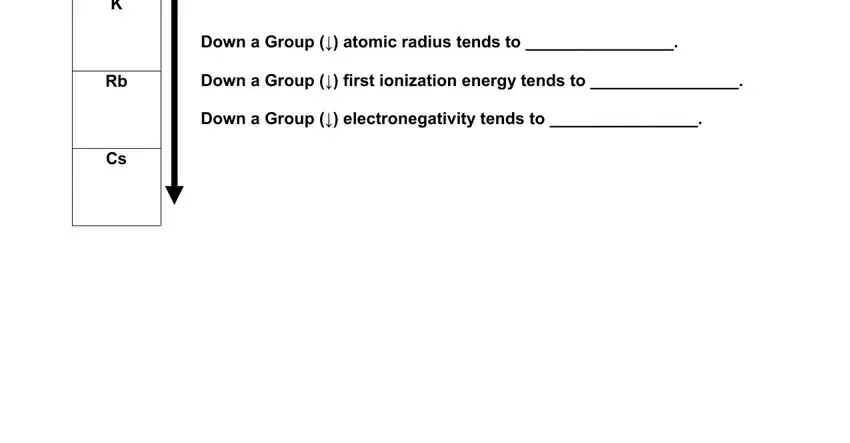
K |
|
|
|
|
|
|
|
|
|
Down a Group (↓) atomic radius tends to ________________. |
|
|
Down a Group (↓) first ionization energy tends to ________________. |
Rb |
|
Down a Group (↓) electronegativity tends to ________________. |
|
|
|
|
|
|
|
|
|
|
Cs |
|
|
|
|
|
|
|
|
|
|
|
|
|
|
|
|
|