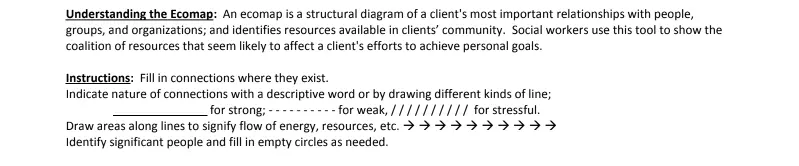
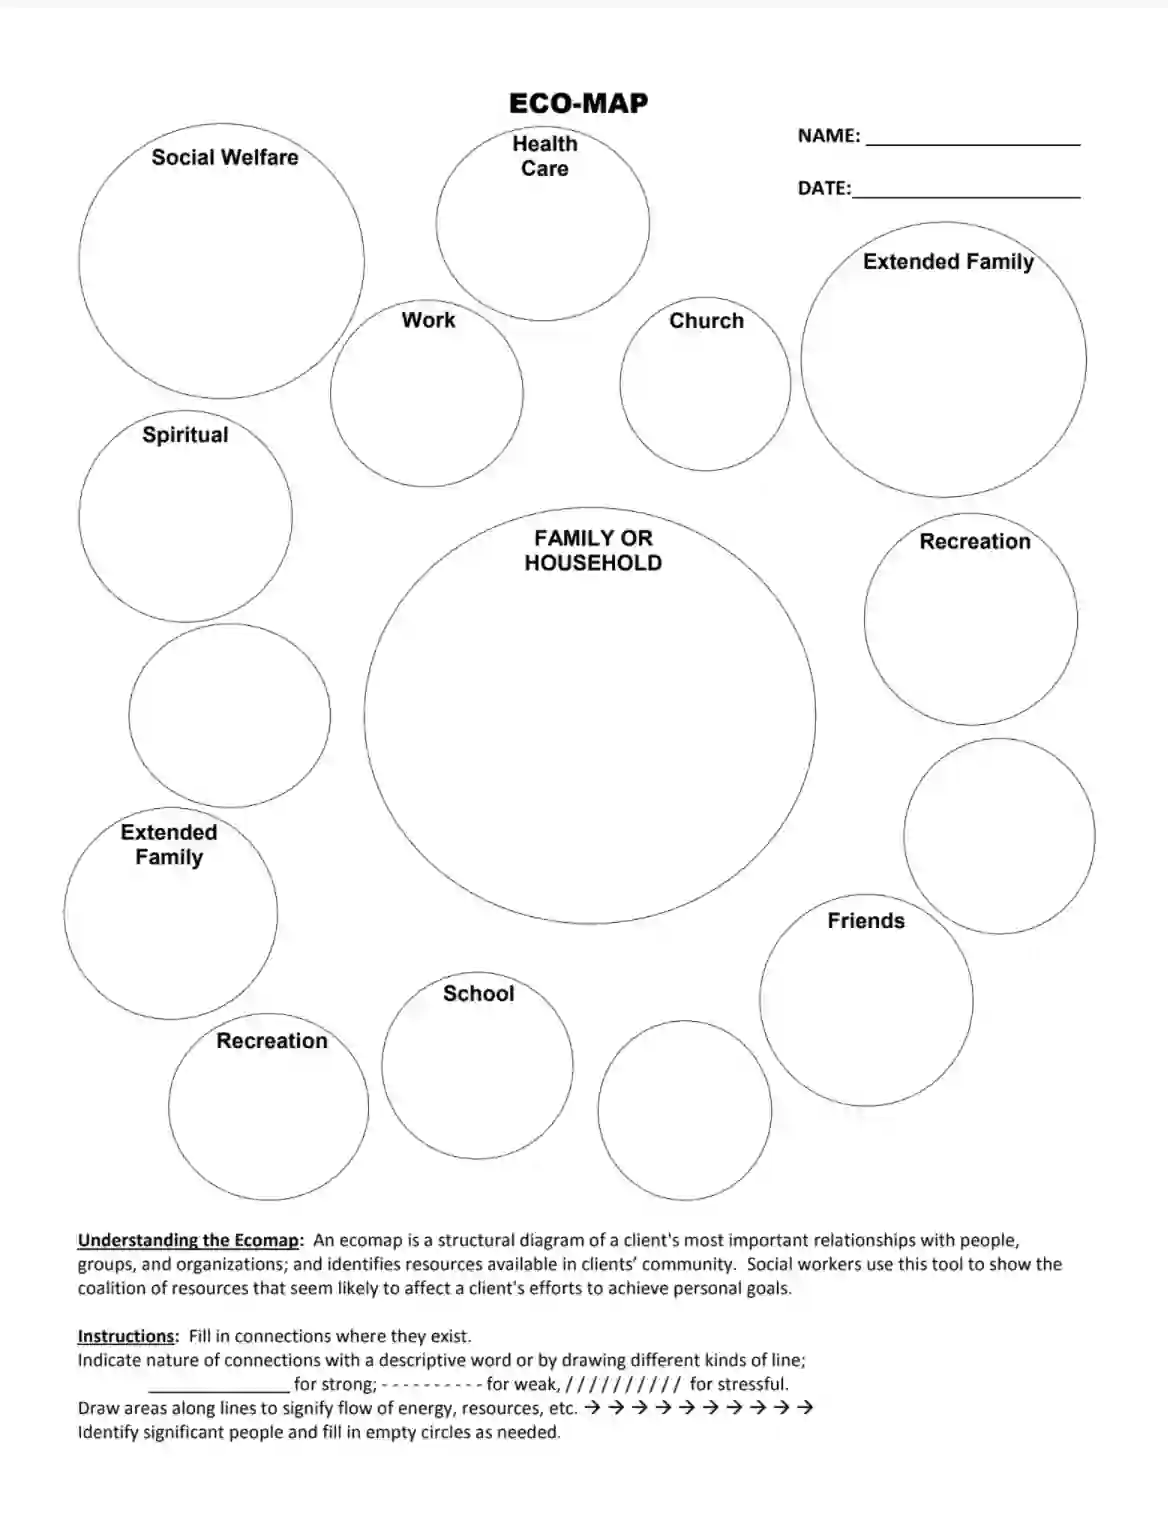
An Eco Map is a graphical representation that visualizes the social and personal relationships of an individual within their ecosystem. Developed by Dr. Ann Hartman in 1975, it serves as a tool primarily used by social workers, therapists, and counselors to assess the quality and strength of an individual’s connections to family, friends, and community resources. The map typically features the individual at the center with various lines connecting to different systems or people, indicating the nature of the relationship (strong, strained, supportive) and the flow of energy or resources (one-way, reciprocal). This visualization helps professionals understand the environmental and relational context of a person’s life, highlighting areas of support and potential stress points.
The Eco Map is particularly useful in family and community therapy settings where understanding complex relational dynamics is crucial. It assists practitioners in identifying the support systems available to the individual, such as educational institutions, healthcare providers, and social services, as well as potential gaps in support.
Other Charts and Tables
If you’d like to check more charts and tables documents that you can edit and fill in here, here are several of the more popular forms among our users. Additionally, remember that you may upload, fill out, and edit any PDF document at FormsPal.
1. Prepare a white piece of paper of the appropriate size. Write down the date of the ecomap drawing.
2. Draw a big circle in the middle of it and write an individual’s name in there. Or, if you’re drawing an ecomap for the family, draw circles for every family member with their names in them (squares to males and circles for women).
3. Add smaller circles around the main one and fill in individual’s friends, social contacts, entities, and groups. For example, these groups can include churches, educational institutes, workplaces.
4. Decide what kind of relationships an individual has with all those spheres. Types and thicknesses of lines depend on it. Dashed lines represent an unstable connection; thick lines highlight a positive and solid connection; crossed lines mean a tense connection; arrows along lines show the direction energy and resources flow.
5. Use different lines to highlight the relationships of an individual towards the church, school, welfare support agency, work, and other environmental systems. If you create an ecomap for the family, using lines show relationships between family members and their connection to the systems mentioned before. Try to highlight as many systems as possible.
6. Add the legend explaining the lines and symbols’ meanings.