In an ever-evolving world of data visualization, professionals and students alike continuously seek methods to accurately interpret and present data. Among the plethora of tools available, dot plots, histograms, and box plots stand out for their unique approach to data presentation. Each of these forms comes with its specific set of strengths and limitations, making the choice of which to use pivotal depending on the data's nature and the message intended to be conveyed. The Merits Demerits Histogram form, for instance, serves as a comprehensive quiz facilitating the understanding of fundamental aspects of these forms, including the interpretation of minimum, maximum, and median values, as well as the calculation of means. It further delves into a critical analysis by listing advantages and disadvantages of each form. For example, while dot plots are lauded for their effectiveness with small data sets and clarity in displaying outliers and clusters, histograms are preferred for larger data sets despite their limitation to numerical data. Conversely, box plots offer insights into range and distribution but fall short in showcasing original data. Analyzing these comparative insights not only enhances one's data presentation skills but also fosters a deeper understanding of the intricate dynamics between data visualization tools and the data they represent.
| Question | Answer |
|---|---|
| Form Name | Merits Demerits Histogram Form |
| Form Length | 1 pages |
| Fillable? | No |
| Fillable fields | 0 |
| Avg. time to fill out | 15 sec |
| Other names | advantages of histogram in statistics, advantages and disadvantages of histogram, histogram advantages and disadvantages pdf, histogram merits and demerits |
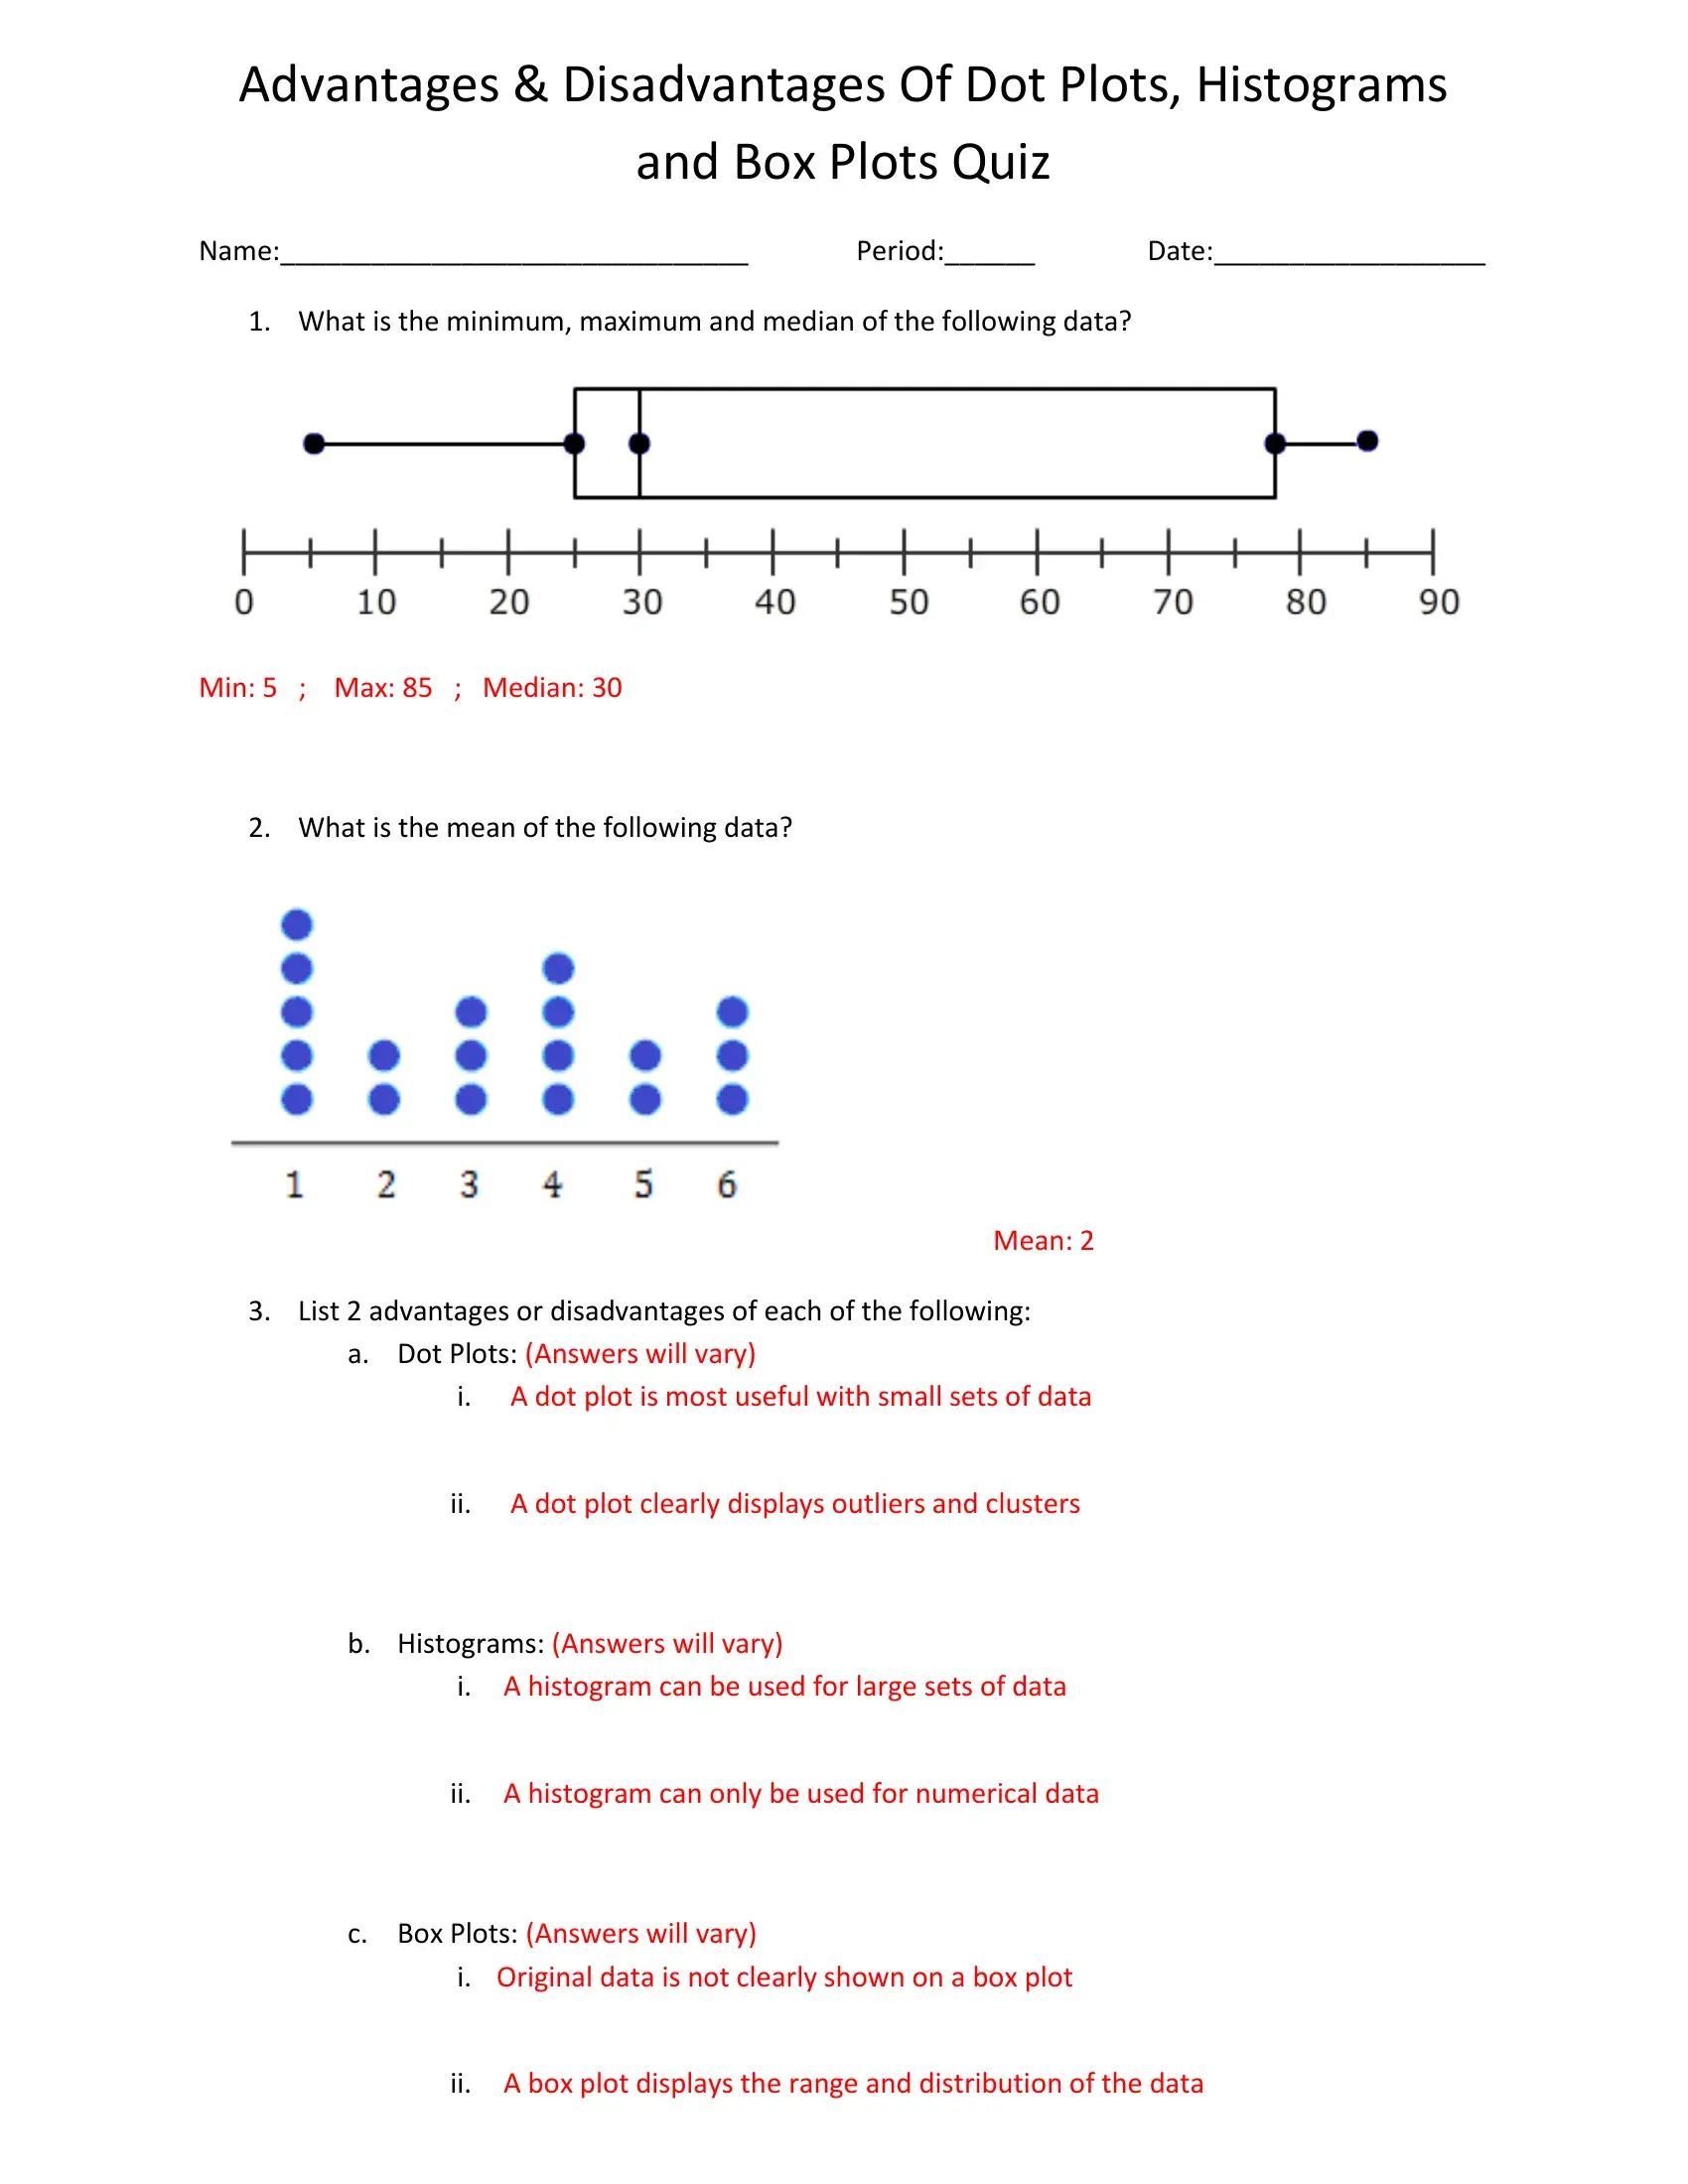
Advantages & Disadvantages Of Dot Plots, Histograms
and Box Plots Quiz
Name:_______________________________ |
Period:______ |
Date:__________________ |
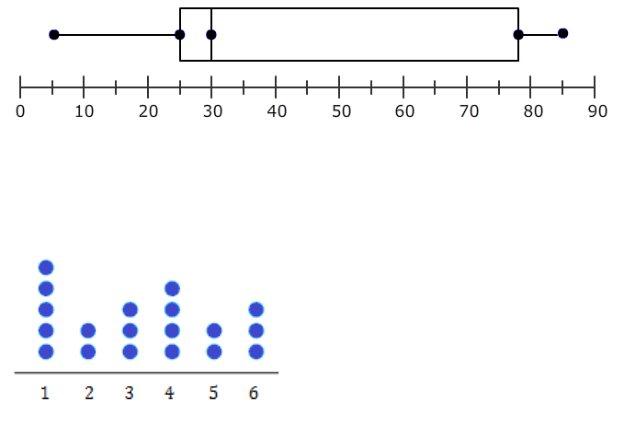
1. What is the minimum, maximum and median of the following data? |
|
|
Min: 5 ; Max: 85 ; Median: 30
2. What is the mean of the following data?
Mean: 2
3.List 2 advantages or disadvantages of each of the following:
a.Dot Plots: (Answers will vary)
i.A dot plot is most useful with small sets of data
ii.A dot plot clearly displays outliers and clusters
b.Histograms: (Answers will vary)
i.A histogram can be used for large sets of data
ii.A histogram can only be used for numerical data
c.Box Plots: (Answers will vary)
i.Original data is not clearly shown on a box plot
ii.A box plot displays the range and distribution of the data